Hmm. My inner troubleshooter still says fresh load the OS without any MFR add on software and go from there.
Example of a "bad" speaker
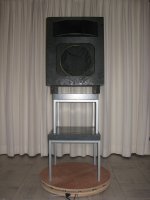
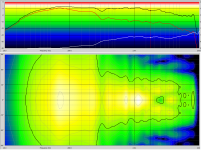
Here is an example of a "bad" speaker (at least when you look at the polar plot). It is a classic Vitavox Bitone 3200 speaker with multicell horn and original crossover.
I again measured this speaker with 14 measurement angles (ala Geddes), and once every degrees (180 measurements). The 14 measurement angles I did both in ARTA and in Holmimpulse (export of holm is attached).
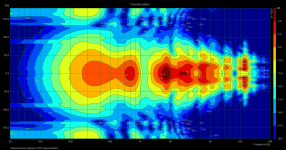
Because this speaker directivity is so irregular, there are now clear differences between the 14 angle plot, and the 180 one.
Looking forward to see how wel Dr. Geddes method performs…
What is also clear, it that even a high quality classic speaker (which I think vitavox is), is nowhere near a good modern product.
Here is an example of a "bad" speaker (at least when you look at the polar plot). It is a classic Vitavox Bitone 3200 speaker with multicell horn and original crossover.
I again measured this speaker with 14 measurement angles (ala Geddes), and once every degrees (180 measurements). The 14 measurement angles I did both in ARTA and in Holmimpulse (export of holm is attached).
Because this speaker directivity is so irregular, there are now clear differences between the 14 angle plot, and the 180 one.
Looking forward to see how wel Dr. Geddes method performs…
What is also clear, it that even a high quality classic speaker (which I think vitavox is), is nowhere near a good modern product.
Attachments
_wim_ thanks for the new data.
My web problem was solved today after 2 hours with a very knowledgeable gentleman. It was trivial to fix once we had found the problem. Turns out it was not new, lots of people had seen this, you just had to understand what the root problem was and not all the symptoms. So I will post a new version of polarmap in a few days.
I know why the app installer fails for anything other than MS IE. If there is anyone who knows HTML very well that could get in touch with me maybe we could fix this. The HTML page that VS generates uses a call that only IE uses. I don't know how to replace that call with one that is more generic - I am not an HTML expert.
Hi _Wim_
The data gives better results, but there is still what I will call a "ghost" in the off-axis response. When I look back on a lot of my own data I see it there as well. It is not there in the older real analysis. So let me take some time and do two things; 1) resurrect the older real analysis; and 2) see if I can find any bugs in the complex code that I might have missed. I never really looked at the results that hard before so I didn't notice these ghosts. The stuff near the main axis all seems fine, its just at the lower level off axis stuff.
The data gives better results, but there is still what I will call a "ghost" in the off-axis response. When I look back on a lot of my own data I see it there as well. It is not there in the older real analysis. So let me take some time and do two things; 1) resurrect the older real analysis; and 2) see if I can find any bugs in the complex code that I might have missed. I never really looked at the results that hard before so I didn't notice these ghosts. The stuff near the main axis all seems fine, its just at the lower level off axis stuff.
If there are two databases then we all know what the characteristics of each of them are. In what way is this any different than just having one database and a notation about what these characteristics are?
I had made the suggestion of two databases based on your comment that if you had to choose, you would pick a large database of LR(lower resolution) data over a small database of HR(higher resolution ) data, but you would miss some important details with the LR process. Suppose you received data for 100 speakers and 20 were of appropriate format to create HR data. Database A would contain all 100 speakers processed in the same LR manner so comparisons would be meaningful and not clouded by different processing or resolution. The 20 cases could also be used with your HR modal process and added to Database O. Again, all entrees in database O could be compared without processing/resolution difference clouding the issue.
What the two database approach avoids is making design decisions based on comparing features of a HR polar map of one speaker with the LR polar map of another. It could be that the features you like(or dislike) in the HR data may be there in the other speaker as well, but you can’t see it because of the LR processing. Being able to compare the LR data for both speakers would help determine whether this is likely the case or not.
Alternatively, the LR & HR data could be put in the same database, but with a resolution “Key” that you could select. HR, LR, or ALL data.
This is similar to how wind tunnel data of varying fidelity(ie tap density) is sometimes handled.
Alternatively, the LR & HR data could be put in the same database, but with a resolution “Key” that you could select. HR, LR, or ALL data.
This is how I would do it if I were to have a large amount of data of the differing types.
As it stands right now I am not confident enough in the complex data to post it that way. It is curious that the plots that I did for you on the simulated data did not show any of the "ghost" lobes that I find in other data. So it is probably not a problem with the calculations, but more one of the setup and rotation axis.
Be carefully not to make setup to tricky to do correct, because otherwise people will have a tendency to distrust the data, and this is definitely something you want to avoid in a project like this. The system needs to be very robust, if your end goal is collect data from many users around the world.
This is precisely why the real data approach is more likely to be useful, because it is much more robust. The complex approach works well for me, but then I have many years experience with the techniques. The complex approach has some better resolution as the data approaches 10 kHz and above, but is much more sensitive to setup problems. Better a little less resolution and stable data. It is always possible to just add more points to enhance resolution, but I think that what is there now is a good tradeoff between time and resolution.
It dawned on my that all I had to do was make the complex data real just before the calculations and the fact that the calculations were done complex should make no difference if the data is real. In other words there was no reason to use the older real based subroutines, just make the data real. So I did this with a simple switch.
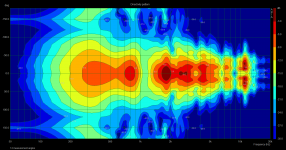
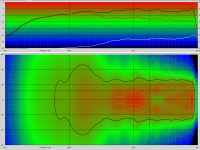
Below are the results - complex on the left. Just as expected with older data that was not carefully time synched, ghosts show up off axis. The real data does not do this. The differences can be seen, but for the most part the real data resolution is just fine.
The complex analysis does improve the use of two drivers in a crossover simulation, but that is not what we are talking about using here.
So real it is from here on in for any publicly displayed data.
Attachments
It dawned on my that all I had to do was make the complex data real just before the calculations and the fact that the calculations were done complex should make no difference if the data is real. In other words there was no reason to use the older real based subroutines, just make the data real. So I did this with a simple switch.
Below are the results - complex on the left. Just as expected with older data that was not carefully time synched, ghosts show up off axis. The real data does not do this. The differences can be seen, but for the most part the real data resolution is just fine.
The complex analysis does improve the use of two drivers in a crossover simulation, but that is not what we are talking about using here.
So real it is from here on in for any publicly displayed data.
Looks ok for me. Still need to adjust myself a little to the color-code used, but that will come when I frequently look at the hopefully very big database…
This is good news. 🙂...Just as expected with older data that was not carefully time synched, ghosts show up off axis. The real data does not do this. The differences can be seen, but for the most part the real data resolution is just fine.
Better a little less resolution and stable data.
So processing with real data:
- removes requirement for time synced data, and
- is less critical as far as rotation center location?
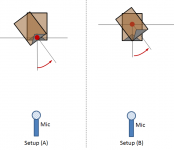
Would you expect measurements taken at 1.5m with Setup (A) & (B) to give essentially identical results?
I'm wondering if the reason the data from _Wim_ has been problematic is because of the short measurement distance in comparison to the size of the enclosure.
Better a little less resolution and stable data.

Attachments
Last edited:
Looks ok for me. Still need to adjust myself a little to the color-code used, but that will come when I frequently look at the hopefully very big database…
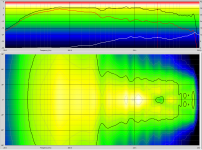
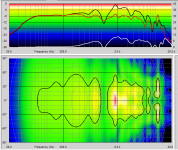
There is also a color scheme option now:
This is your latest data - no ghosts.
Attachments
Last edited:
This is good news. 🙂
So processing with real data:
- removes requirement for time synced data, and
- is less critical as far as rotation center location?
Would you expect measurements taken at 1.5m with Setup (A) & (B) to give essentially identical results?
I'm wondering if the reason the data from _Wim_ has been problematic is because of the short measurement distance in comparison to the size of the enclosure.
"Essentially the same" would be what I would expect in those two examples. His enclosure is identical to what I have been using for years so it is not the enclosure size.
I am pretty certain that the complex would be sensitive to the correct distance from the axis of rotation to the measurement and I may not be calculating this right. I am going to check on that. with real data it doesn't really matter much.
There is also a color scheme option now:
This is your latest data - no ghosts.
I would be usefull if you also added a chart with colors used and dB scale, this make it easier to interprete or get used to the colors
=> jusr occured to my you can see this clearly in the plot above
Last edited:
Actually there is a legend on the plots, it just got cutoff in the capture.
I will post this new version of polarmap sometime this weekend and add the data that I have received
I will post this new version of polarmap sometime this weekend and add the data that I have received
Actually there is a legend on the plots, it just got cutoff in the capture.
I will post this new version of polarmap sometime this weekend and add the data that I have received
Great. Looking forward to playing with it.
The all new PolarMap program has been posted with the three additions of data from this thread.
I sincerely hope that we can see more additions to this database.
PS. right click on the main plot for the options menu (limited right now.)
When installing in Win 8 you have to keep selecting Install Anyways. I don't have a code certificate - they aren't cheap - and so Windows keeps telling you to beware of unsigned code. Its kind of a way of keeping little guys like me out of the business. (I suppose it also helps for more secure code.)
- Status
- Not open for further replies.
- Home
- Loudspeakers
- Multi-Way
- Measurement technology