*** Long-windedness alert ***
I often read about how published T/S parameters are but a point on a non-linear curve where the test conditions are usually not really known. This often comes up when people measure much different parameters for their new drivers.
I've just received a pair of Faital Pro 6FE100 drivers where I'm having an experience as described above. Let's start out with the manufacturer's published data:

These are what I had based an intended design on naturally. A 2008 bench test by Vance Dickason in "Voice Coil" bolstered my confidence in the parameters:

I decided to measure parameters myself using LIMP and the recommended impedance jig driven from the headphone output of my USB audio interface. Here's what I got:

Fs = 85.76 Hz
Re = 5.60 ohms[dc]
Le = 251.21 uH
L2 = 308.35 uH
R2 = 7.44 ohms
Qt = 0.82
Qes = 0.89
Qms = 10.26
Mms = 9.26 grams
Rms = 0.515706 kg/s
Cms = 0.000371 m/N
Vas = 10.66 liters
Sd= 142.93 cm^2
Bl = 5.777399 Tm
ETA = 0.77 %
Lp(2.83V/1m) = 92.54 dB
Added Mass Method:
Added mass = 15.00 grams
Diameter= 13.49 cm
This is the data for one driver only, but the second one did not significantly differ from the above data set.
Naturally, this is really small-signal with a total output of 217mV, how much of it being across the driver itself depending on its impedance as this is ~current drive.
Viewed as a static data set (which it isn't), this pretty much invalidates my original enclosure design. Vance Dickason's test was done at higher drive levels and I may yet get closer results were I to do this. I intend to try and use an amplifier and audio input level protection to do this soon enough, when I get to set things up.
In the meantime, I dove somewhat deeper than I had before into dynamic behavior of loudspeaker drivers, to try and see if my differing results make sense at least. Fs and Qt are two of the most looked-at parameters when it comes to judging a driver's suitability for types of alignment. These are somewhat only incidental to rather more telling parameters, Mms and Cms/Kms, as I gather. Fs and Qt greatly differ in my measurements and are the biggest "bummer" at face value here. 🙂 How to explain that large an upwards deviation then?
Fs = 1 / (2π √(Mms Cms)
Qt = √(Mms / Cms) (1 / Rmt)
Mms and Cms are found in both the equations and, to a certain extend, tie Fs and Qt together. Cms is a non-linear parameter. Here's a typical example of a Cms(x) curve I retrieved from an article, has nothing to do with my driver:
.png")
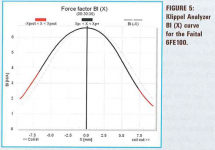
For the Faital 6FE100, Vance Dickason chose to show the inverse, Kms(x):
.png")
It seems that a coil-out offset is very common and that the rest/'zero' position is typically not quite at Cms peak value. Vance's Kms(x) plot does show that outward offset, but the rest position does seem to be very close to the Kms minimum, Cms maximum IOW. I understand this to mean that smaller excursions will be in a fairly linear and relatively at the maximum of suspension compliance.
Faital published Cms = 0.48mm/N
Vance D. measured Cms = 0.68mm/N (not published, but calculated by inputting rest of his data in WinISD editor)
my measured Cms = 0.37mm/N
Since my test was done at very low signal, I assume I should get a reading of ~maximum compliance, no? Would my significantly lower Cms simply mean I have stiffer spiders on my drivers?
Here's a graphic showing changes in Fs with drive level, something I believed to be 'set in stone' before now. I got this from this 2009 ALMA document.

It is not entirely clear in the document which drive level results in which Fs - probably assumed knowledge on the part of the intended audience 🙂 - but I see it as smaller drive level = higher Fs/Qt, is this correct? It would indeed then fit with my measurements, not that I'm going for full-on confirmation bias mind you. 😉 It is also stated that this is an effect of compliance non-linearity (Cms(x) curve).
Now on to the second rather important parameter, Mms. This would seem is very straightforward. Faital states it as 14g for the 6FE100, and this is the value, not published but extrapolated in WinISD, used by Vance Dickason as well. It seems the manufacturer should have a very precise value for Mmd at the very least. It is the weight of physical parts of the driver, add the bit of air that "rides along" and you get Mms.
Let's look at my data set, Mms=9.26g. Significantly lower, how is this? While there is no published Mmd spec for the 6FE100, inputing Sd and Cms in Hornresp results in a calculated 13.2g, indicating that very little air "rides along". This seems like quite a high Mmd/Mms ratio at 94.3%. Other drivers I checked seem to come in in the 75%-85% range, but these are generally larger units to be fair and possibly differ in how radiation resistance comes into play to calculate Mms. Checking for a 3" driver, the ratio is ~99%, so perhaps this is correct.
So could it be that at such a low drive level (217mV total output from headphone out, most of it dropped across the 100ohm sense resistor), what little cone excursion is going on does not even excite the whole mass of the moving assembly? This would partly make for a higher Fs/Qt as I understand. Why else would I get a significantly lower Mms reading? Is it not a linear parameter? Perhaps not so in my testing range so far.
As I mentioned earlier, I need to set up a high(er)-level test rig for LIMP. Perhaps some of my above questions will get answered. In the meantime, I'd appreciate any input and wisdom on the subject.
I often read about how published T/S parameters are but a point on a non-linear curve where the test conditions are usually not really known. This often comes up when people measure much different parameters for their new drivers.
I've just received a pair of Faital Pro 6FE100 drivers where I'm having an experience as described above. Let's start out with the manufacturer's published data:
These are what I had based an intended design on naturally. A 2008 bench test by Vance Dickason in "Voice Coil" bolstered my confidence in the parameters:
I decided to measure parameters myself using LIMP and the recommended impedance jig driven from the headphone output of my USB audio interface. Here's what I got:
Fs = 85.76 Hz
Re = 5.60 ohms[dc]
Le = 251.21 uH
L2 = 308.35 uH
R2 = 7.44 ohms
Qt = 0.82
Qes = 0.89
Qms = 10.26
Mms = 9.26 grams
Rms = 0.515706 kg/s
Cms = 0.000371 m/N
Vas = 10.66 liters
Sd= 142.93 cm^2
Bl = 5.777399 Tm
ETA = 0.77 %
Lp(2.83V/1m) = 92.54 dB
Added Mass Method:
Added mass = 15.00 grams
Diameter= 13.49 cm
This is the data for one driver only, but the second one did not significantly differ from the above data set.
Naturally, this is really small-signal with a total output of 217mV, how much of it being across the driver itself depending on its impedance as this is ~current drive.
Viewed as a static data set (which it isn't), this pretty much invalidates my original enclosure design. Vance Dickason's test was done at higher drive levels and I may yet get closer results were I to do this. I intend to try and use an amplifier and audio input level protection to do this soon enough, when I get to set things up.
In the meantime, I dove somewhat deeper than I had before into dynamic behavior of loudspeaker drivers, to try and see if my differing results make sense at least. Fs and Qt are two of the most looked-at parameters when it comes to judging a driver's suitability for types of alignment. These are somewhat only incidental to rather more telling parameters, Mms and Cms/Kms, as I gather. Fs and Qt greatly differ in my measurements and are the biggest "bummer" at face value here. 🙂 How to explain that large an upwards deviation then?
Fs = 1 / (2π √(Mms Cms)
Qt = √(Mms / Cms) (1 / Rmt)
Mms and Cms are found in both the equations and, to a certain extend, tie Fs and Qt together. Cms is a non-linear parameter. Here's a typical example of a Cms(x) curve I retrieved from an article, has nothing to do with my driver:
For the Faital 6FE100, Vance Dickason chose to show the inverse, Kms(x):
It seems that a coil-out offset is very common and that the rest/'zero' position is typically not quite at Cms peak value. Vance's Kms(x) plot does show that outward offset, but the rest position does seem to be very close to the Kms minimum, Cms maximum IOW. I understand this to mean that smaller excursions will be in a fairly linear and relatively at the maximum of suspension compliance.
Faital published Cms = 0.48mm/N
Vance D. measured Cms = 0.68mm/N (not published, but calculated by inputting rest of his data in WinISD editor)
my measured Cms = 0.37mm/N
Since my test was done at very low signal, I assume I should get a reading of ~maximum compliance, no? Would my significantly lower Cms simply mean I have stiffer spiders on my drivers?
Here's a graphic showing changes in Fs with drive level, something I believed to be 'set in stone' before now. I got this from this 2009 ALMA document.
It is not entirely clear in the document which drive level results in which Fs - probably assumed knowledge on the part of the intended audience 🙂 - but I see it as smaller drive level = higher Fs/Qt, is this correct? It would indeed then fit with my measurements, not that I'm going for full-on confirmation bias mind you. 😉 It is also stated that this is an effect of compliance non-linearity (Cms(x) curve).
Now on to the second rather important parameter, Mms. This would seem is very straightforward. Faital states it as 14g for the 6FE100, and this is the value, not published but extrapolated in WinISD, used by Vance Dickason as well. It seems the manufacturer should have a very precise value for Mmd at the very least. It is the weight of physical parts of the driver, add the bit of air that "rides along" and you get Mms.
Let's look at my data set, Mms=9.26g. Significantly lower, how is this? While there is no published Mmd spec for the 6FE100, inputing Sd and Cms in Hornresp results in a calculated 13.2g, indicating that very little air "rides along". This seems like quite a high Mmd/Mms ratio at 94.3%. Other drivers I checked seem to come in in the 75%-85% range, but these are generally larger units to be fair and possibly differ in how radiation resistance comes into play to calculate Mms. Checking for a 3" driver, the ratio is ~99%, so perhaps this is correct.
So could it be that at such a low drive level (217mV total output from headphone out, most of it dropped across the 100ohm sense resistor), what little cone excursion is going on does not even excite the whole mass of the moving assembly? This would partly make for a higher Fs/Qt as I understand. Why else would I get a significantly lower Mms reading? Is it not a linear parameter? Perhaps not so in my testing range so far.
As I mentioned earlier, I need to set up a high(er)-level test rig for LIMP. Perhaps some of my above questions will get answered. In the meantime, I'd appreciate any input and wisdom on the subject.
Attachments
Last edited:
You did not say if you ran the driver for any length of time at any reasonable power level before testing the parameters?
I like to run the driver at subsonic frequencies (like 8-15Hz. for example) at a fairly high excursion (does not take much power to get that done) before testing. The suspension "new out of the box" tends to be somewhat different than after it is run.
I would be somewhat concerned about the higher apparent Qt in your test, but this could be due to what you suggested.
Other than different parameters effecting the actual physical build of an enclosure, what is your concern. I'd always build a test box (ugly thrown together quickly and cheap) before committing to a finished enclosure, only to find it is too small. Too big is not a problem, fwiw.
The typcial test level afaik is 1watt. You could test at higher levels of course.
I suspect ur cutting it "too fine" - since you can't alter the performance of a given driver. If ur building drivers, perhaps these details are important?
My 2 cents worth... maybe not that much.
You did not say if you ran the driver for any length of time at any reasonable power level before testing the parameters?
I like to run the driver at subsonic frequencies (like 8-15Hz. for example) at a fairly high excursion (does not take much power to get that done) before testing. The suspension "new out of the box" tends to be somewhat different than after it is run.
I would be somewhat concerned about the higher apparent Qt in your test, but this could be due to what you suggested.
Other than different parameters effecting the actual physical build of an enclosure, what is your concern. I'd always build a test box (ugly thrown together quickly and cheap) before committing to a finished enclosure, only to find it is too small. Too big is not a problem, fwiw.
The typcial test level afaik is 1watt. You could test at higher levels of course.
I suspect ur cutting it "too fine" - since you can't alter the performance of a given driver. If ur building drivers, perhaps these details are important?
My 2 cents worth... maybe not that much.
I pushed ~10V for a few hours at 10Hz-30Hz (varied it once every 20min or so). Before/after readings did not significantly vary.
FWIW, the spiders do feel quite stiff, subjectively. OTOH, I know this is a pro driver and likely not meant to do any kind of LF in its intended application. The rubber half-roll surrounds are quite supple and are probably swamped by the spider in total Cms/Kms.
Yes, of course we can't change much about a driver and I'll be slightly more concerned if higher-level T/S testing does not lower Fs/Qt to at least no more than ~10% above factory, which I'm hoping will happen. 🙂
1W test level would already be much higher than what my headphone out provides, possibly a good 10x more. At least getting a level where the speaker is likely to be listened at would make sense? The full 217mV would only take this driver mid-60dB's, which it's not even getting in full due to the 100R resistor.
Yes, this may indeed be cutting it too fine, but I'm trying to make sense of why my data came out as such. I won't likely be building a completely different box based on any knowledge gathered here, but it's good to know still. 🙂 I suppose the main points I'm not entirely clear about are:
- Should small-signal not be measuring Cms at ~peak value? So why does it produce a higher Fs if compliance is close to maximum?
- Does my lower (than published and Vance's) Cms simply mean a stiffer spider for some reason? This answer might then depend on the previous point.
- Why is my Mms reading quite a bit lower than what should be a pretty accurate factory spec? Does small-signal testing not excite the full mass of the moving assembly? Is this then not a linear parameter?
Thanks for the comments!
Last edited:
There are several things that I have concluded about TS parameters:
1) They are almost never what the manufacturer claims them to be
2) They are highly unstable to measure and very dependent on technique
3) they have almost nothing to do with the resulting sound quality of an audio system
I have not measured TS parameters of drivers that I use in more than 10 years. They don't matter much so I don't care.
There has never been a more over rated point of view on audio than "low frequency alignments" based on the TS numbers. In the room none of this makes much, if any, difference - the room will dominate the situation. And they say nothing at all about the upper 90% of the spectrum, which is something like 80% of our perception of sound quality.
There are several things that I have concluded about TS parameters:
1) They are almost never what the manufacturer claims them to be
2) They are highly unstable to measure and very dependent on technique
3) they have almost nothing to do with the resulting sound quality of an audio system
I have not measured TS parameters of drivers that I use in more than 10 years. They don't matter much so I don't care.
There has never been a more over rated point of view on audio than "low frequency alignments" based on the TS numbers. In the room none of this makes much, if any, difference - the room will dominate the situation. And they say nothing at all about the upper 90% of the spectrum, which is something like 80% of our perception of sound quality.
I hadn't measured T/S for my last few builds to be honest and just went with factory data. They turned out great subjectively and measurably too, as far as I can measure LF alignments. 🙂
Thanks for the input!
Last edited:
I have not measured TS parameters of drivers that I use in more than 10 years. They don't matter much so I don't care.
I bought four B&C 18" last year and was impressed with the cosistency of the TS specs between drivers. Fs was identical between all of them. I thought something was wrong with the software.
I bought four B&C 18" last year and was impressed with the cosistency of the TS specs between drivers. Fs was identical between all of them. I thought something was wrong with the software.
How did they do versus factory data? What drive level did you use to test?
Consistency is a good thing in itself IMO, I at least have this right now with my 6FE100 pair. 🙂
I bought four B&C 18" last year and was impressed with the cosistency of the TS specs between drivers. Fs was identical between all of them. I thought something was wrong with the software.
I have to say that B&C is the exception. They actually do produce reliable data for the most part - but not always. Others companies!? Some are absolutely terrible, as if the data sheets are a complete fabrication.
Consistency is a good thing in itself IMO, I at least have this right now with my 6FE100 pair. 🙂
Above the fundamental resonance consistency is critical and consistency of the TS numbers is good evidence that the rest will be consistent as well. It goes without saying that if you cannot hold the TS stable then you certainly cannot hold anything else stable.
Hi IG81,
When I looked at your LIMP graphs I wondered if they represented the impedance responses corresponding to the “with and without” 15grams added mass.
If this is the case, then the added mass response should show a shift in its frequency peak of Fs/sqr(15g/10g), ie, it should have changed from 85.76Hz down to 70Hz.
I would suggest that you check that the added 15g mass was securely attached to the cone when you made the measurements. I agree with you that making these tests at a higher level would definitely improve the accuracy of the results. Hope this helps.
Peter
Hi IG81,
When I looked at your LIMP graphs I wondered if they represented the impedance responses corresponding to the “with and without” 15grams added mass.
If this is the case, then the added mass response should show a shift in its frequency peak of Fs/sqr(15g/10g), ie, it should have changed from 85.76Hz down to 70Hz.
I would suggest that you check that the added 15g mass was securely attached to the cone when you made the measurements. I agree with you that making these tests at a higher level would definitely improve the accuracy of the results. Hope this helps.
Peter
The LIMP plot is the two drivers overlayed, to show their similar measurements, I should have mentioned it. 🙂 I didn't save the added-mass plot, but it went down enough, <70Hz at least. I tried it with 23g as well and the results were the same.
I would suggest that you check that the added 15g mass was securely attached to the cone when you made the measurements. I agree with you that making these tests at a higher level would definitely improve the accuracy of the results. Hope this helps.
Peter
Correct, the mass must be very securely attached, but too high a test level presents its own set of problems as well. A nice "normal" level is best.
I would suggest that you check that the added 15g mass was securely attached to the cone when you made the measurements. I agree with you that making these tests at a higher level would definitely improve the accuracy of the results. Hope this helps.
Correct, the mass must be very securely attached, but too high a test level presents its own set of problems as well. A nice "normal" level is best.
Alright, so I managed to set up a high-level impedance jig to use with an amplifier. Well, 'high-level' not so much as I can only get about 2.6V total output before clipping the sound card inputs. Strange, as I have a 20dB pad on the sound card input (UCA-222), its max input is 2dBV, so 1.26V and generator testing still shows clipped inputs at low levels. Seems like I should be able to get ~12V total output before that pad. In any case, it's already much louder than previously, perhaps at that "normal" level referred to above. The Fs and Q-parameters did not appreciably change.
Loudspeaker parameters:
Fs = 86.19 Hz
Re = 5.60 ohms[dc]
Le = 251.23 uH
L2 = 299.61 uH
R2 = 8.71 ohms
Qt = 0.92
Qes = 1.00
Qms = 11.00
Mms = 14.39 grams
Rms = 0.707299 kg/s
Cms = 0.000239 m/N
Vas = 6.86 liters
Sd= 142.93 cm^2
Bl = 6.585896 Tm
ETA = 0.42 %
Lp(2.83V/1m) = 89.84 dB
Added Mass Method:
Added mass = 37.00 grams
Diameter= 13.49 cm
Prompted by the quoted comments, I did take a look at how I attached my added mass and now realize I had introduced another degree of freedom and a parasitic resonance resulted. The above was much better attached and produce only the one peak at a lower frequency. 😱
So at this point I have to hope for the spider to loosen-up I suppose? That or at least prototype in pink insulation foam before I commit to plywood.
So at this point I have to hope for the spider to loosen-up I suppose? That or at least prototype in pink insulation foam before I commit to plywood.
Try modeling the same size box with both sets of parameters. Often purely compliance changes (like you are seeing) make very little difference, even when quite large.
Try modeling the same size box with both sets of parameters. Often purely compliance changes (like you are seeing) make very little difference, even when quite large.
As far as Fs and Qt is concerned, I would not consider venting such a driver, which was my plan. It simulates terribly, at least as far as what I've learned based on the general T/S paradigm. The compliance number itself is probably now more meaningful to me after having done a little "research" just to type my first post, but it's still not as concrete as how I view Fs/Q, whether this is correct or not. 🙂
Try modeling the same size box with both sets of parameters. Often purely compliance changes (like you are seeing) make very little difference, even when quite large.
Ok, the BVR-style enclosure I planned on may not be completely worthless with the latest posted parameters. It will get a broad and chunky hump just above the 100Hz mark and perhaps a tad less extension + sharper roll-off. Certainly will fill-in the baffle step. The actual enclosure simulated in Hornresp looks more encouraging than a straight bass-reflex in WinISD. Some small tuning/stuffing tweaks may be required yet.
Also note that my latest set of parameters appears to get the correct value for Mms, ~14g, so this is one point I can strike from my list. This was due to driver error. 🙂 Thanks for the tip guys.
Last edited:
Hi IG81,
Thanks for the clarification. Both responses would suggest that the drivers are reasonably well matched and that the measurement system is giving consistent results.
However, I think there may be another issue that could be influencing your results.
The problem I see is in the frequency range of 20Hz to 30Hz as shown in your measured impedance curve. In this region, the slope of the curve is negative whereas in a normal driver’s impedance, it would always have a positive slope. The phase response over this frequency range is also strange, because it is constant at about 51 degrees. Normally, I would expect the magnitude of the impedance to gradually reduce to the drivers Re as frequency reduces down towards zero, with the phase eventually going to zero as well.
You may find clues as to what is causing the problem by replacing the speaker with a 5.6 ohm resistor. You should obviously get a flat response across the whole frequency range. As to the generator output level, I normally set mine to about 1Vrms to 1.5Vrms, which I’ve found provides good signal to noise ratio, but doesn’t push the excursion too much at resonance.
Hope this helps.
Peter
The LIMP plot is the two drivers overlayed, to show their similar measurements, I should have mentioned it. 🙂 I didn't save the added-mass plot, but it went down enough, <70Hz at least. I tried it with 23g as well and the results were the same.
Hi IG81,
Thanks for the clarification. Both responses would suggest that the drivers are reasonably well matched and that the measurement system is giving consistent results.
However, I think there may be another issue that could be influencing your results.
The problem I see is in the frequency range of 20Hz to 30Hz as shown in your measured impedance curve. In this region, the slope of the curve is negative whereas in a normal driver’s impedance, it would always have a positive slope. The phase response over this frequency range is also strange, because it is constant at about 51 degrees. Normally, I would expect the magnitude of the impedance to gradually reduce to the drivers Re as frequency reduces down towards zero, with the phase eventually going to zero as well.
You may find clues as to what is causing the problem by replacing the speaker with a 5.6 ohm resistor. You should obviously get a flat response across the whole frequency range. As to the generator output level, I normally set mine to about 1Vrms to 1.5Vrms, which I’ve found provides good signal to noise ratio, but doesn’t push the excursion too much at resonance.
Hope this helps.
Peter
I did think that LF slope was mildly strange, but didn't give it much though. Could it be input capacitors in the UCA-222 audio interface?
I'll try with a resistor of ~Re value to check that. It won't influence the rest of the data at Fs, but it could muck-up drivers with low Fs I suppose.
Alright, a fresh impedance trace, on the 'high-level' (~2V) setup, for the 6FE100:

I would say the LF issue seems absent versus the low-level test setup. Let's see on a 5R6 resistor, down to 3Hz:

Ok, so there is something. The impedance rise is no more than ~7% at 20Hz, so probably not of too much concern for most drivers. I suppose worst case would be a slight effect on the -6dB point on the inductive rise of Fs>20Hz driver and Q-parameters too high by that much.
I'm guessing input caps on the audio interface. 🙂
I would say the LF issue seems absent versus the low-level test setup. Let's see on a 5R6 resistor, down to 3Hz:
Ok, so there is something. The impedance rise is no more than ~7% at 20Hz, so probably not of too much concern for most drivers. I suppose worst case would be a slight effect on the -6dB point on the inductive rise of Fs>20Hz driver and Q-parameters too high by that much.
I'm guessing input caps on the audio interface. 🙂
Last edited:
Hi IG81,
So the higher level actually helped to improve the response at low frequencies -- great. The only other suggestion I have is to use the stepped sign generator which can provide greater noise immunity as described in section 2.4 of the LIMP help file. Unfortunately, it takes a long time to make impedance measurements over a wide frequency range using the stepped sign generator.
If you are using two input channels for measuring impedance, I can only assume that the low frequency response errors are due to the difference in the values of the input capacitors inside your UCA-222 audio interface.
Regards
Peter
Alright, a fresh impedance trace, on the 'high-level' (~2V) setup, for the 6FE100:
View attachment 426644
I would say the LF issue seems absent versus the low-level test setup. Let's see on a 5R6 resistor, down to 3Hz:
View attachment 426646
Ok, so there is something. The impedance rise is no more than ~7% at 20Hz, so probably not of too much concern for most drivers. I suppose worst case would be a slight effect on the -6dB point on the inductive rise of Fs>20Hz driver and Q-parameters too high by that much.
I'm guessing input caps on the audio interface. 🙂
- Status
- Not open for further replies.
- Home
- Loudspeakers
- Multi-Way
- Small-signal loudspeaker parameters: some questioning