"The velocity of propagation in a lossy material follows from v = ω/β, whereby v = √(2ω/µσ). This is very much lower than that for a material with low conductivity.
The important thing to realize is that, for a cable consisting of perfect conductors, the energy that gets transferred from the source to the load is conveyed in a wave that is confined to the dielectric of the cable and surrounding air if any. In this case, Maxwell's equations dictate that no energy is transferred from the source to the load via the conductors (really!). When imperfect conductors are considered, one must think of the problem in terms of the sum of two waves. The first of these waves travels from the source to the load, and for a coax cable or other type of cable for which the mode of propagation is TEM (transverse electromagnetic), this wave travels at the speed of light divided by the square root of the relative dielectric constant (epsilon) of the dielectric material. For solid teflon, for example, epsilon is about 2.2. For the foamed teflon found in coax, it's less than 2. This is the wave that gives you the desired signal at the load, and it travels at just slightly less than the speed of light. The second of these waves is the so-called "loss wave", which is the wave that heats up the conductors. It conveys no energy from the source to the load. It propagates inside the conductors. IOW, it's the wave associated with the energy that never gets to the load, but is lost as heat. It is this wave that has the slow propagation velocity. So Hawksford's statements are somewhat misleading for this reason.
For more info on this, and a critique of the Hawksford article, see this issue of The Audio Critic (PDF) (somewhat humorously referred to as "The Essex Yecch-o") 🙂.
Conclusions:
•Interconnect cables can be quite different from each other (confirmed by measurements), with up to a 20dB difference in the magnitude of losses between common “good” and “bad” interconnects.
Whats the source output impedance? So this is a graph of Vin - Vout across a cable? If you plot those lines so there at the same point at 1K (get rid of the offsets which dont mean much(the resistive drop of the cable) ) youll get a better picture of the F response of each cable which is what makes a difference.Also any chance of plotting phase response? The top 2 (not the red one) look almost identical and the bottom one is the worst. And if the red line is also a cable it looks the flatest. What about plotting Vin and Vout on the same graph? This will show the real response and give someore info
Hi,
So what exactly do you think you're hearing that we don't? Voices?
Cheers, 😉
Frank I am not going to enter into any discussion where there is no civility. Wise cracks and innuendo's will not be tolerated or addressed by me any further.
Hi,
You mean without punity, correct?
More bad news; I am afraid it's mainly you doing the wishful thinking here.
It would be nice if you understood that it's not your hearing abilities that are under attack here, just that you don't seem to be willing to bring any evidence to the table that what you hear is nothing more than shifts in electrical parameters within the various cables you hook your system up with.
Surely, I don't mind to carry this on for another 500 pages or so but does everone?
No hard feelings, 😉
I have no hard feelings toward anyone here. If you choose not learn to listen acutely, that is not my problem. I taught myself how and what to listen for from experience. If that is too far fetched for many of you to comprehend, I have nothing constructive to offer in a discussion here.
Right, no E fields in perfect conductors, some of the EM theory still lodged somwhere in my grey matter, but getting harder to reach every year.
Thank you Andy, starting to make more sense.
For more info on this, and a critique of the Hawksford article, see this issue of The Audio Critic (PDF) (somewhat humorously referred to as "The Essex Yecch-o") .
Thank you Andy, starting to make more sense.
Last edited:
If you choose not learn to listen acutely, that is not my problem. I taught myself how and what to listen for from experience.
Oh yeah, your the only one who knows how to listen!
Right, no E fields in perfect conductors...
Exactly! So the Poynting vector (E cross H) must also be zero inside a perfect conductor, thus no energy transfer from source to load in said conductor.
Oh yeah, your the only one who knows how to listen!
You are on your own with this one. I will not play your games any longer.
cbdb,
The ouput impedance of the source is that of an opamp -what the cable will likely see if used, say, between a preamp and a power amp. This is the graph of (Vin-Vout)/Vin, in dB. So, the top (red) curve is for a cheap interconnect, which has higher overall losses than the other three.
For some reason people seem to prefer (sonically) cables with very low losses, and not only because they are "louder", so if we make all graphs concident at 1 kHz, we won't see the true magnitude of losses. Here we are trying to correlate actual losses to what people are hearing.
Having Vin and Vout in the same graph would show as a single line: keep in mind that Vin and Vout are almost identical to each other, so you have to show the difference between the two, relative to something, that "something" being Vin.
No problem showing the phase response (I turned it off for clarity in the first post).
Cheers,
Ricardo
Having Vin and Vout in the same graph would show as a single line.
Exactly. I think your experiment is exageratig the effects. And then misrepresenting them. You make it sound like one cable is down 20DB at 20k compared to another, which is rubish. What your saying is people can hear the diference in less than .1 db of attenuation between 2 cable while te F response is almost identical. Im having trouble buying that.
Measuring audio interconnects
The chart shows the magnitude of losses in interconnect cables, relative to the input signal, in dB.
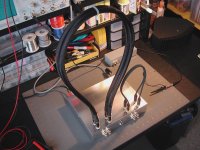
The instrument consists of a "silver black box" where the cable under test is connected, fed by the desired signal (chirp, pink noise, music, whatever). At the output of the black box you have the losses for the cable under test, which you can listen to, or measure in the time or frequency domain.
In the attached picture you can see the 2nd prototype, where I was measuring a low-cost short cable and a long expensive one (it's a 2-channel instrument, so two different cables can be easily compared).
I hope I answered your questions...
R
Could you please explain what that chart is? What does it measure and what was the basic test setup?
The chart shows the magnitude of losses in interconnect cables, relative to the input signal, in dB.
The instrument consists of a "silver black box" where the cable under test is connected, fed by the desired signal (chirp, pink noise, music, whatever). At the output of the black box you have the losses for the cable under test, which you can listen to, or measure in the time or frequency domain.
In the attached picture you can see the 2nd prototype, where I was measuring a low-cost short cable and a long expensive one (it's a 2-channel instrument, so two different cables can be easily compared).
I hope I answered your questions...
R
Attachments
R, many thanks. Can you tell me the driving impedance and terminating impedance? Voltage level for the test?
For more info on this, and a critique of the Hawksford article, see this issue of The Audio Critic (PDF) (somewhat humorously referred to as "The Essex Yecch-o")
Great stuff. Particularly this statement; "Similarly, anything that takes place inside the conductor such as boundries, grains, and all that junk are irrelevant, since any energy that enters the surface of the conductor is lost as heat anyway. ... it never again contributes to the information travelling along the axis of the conductor"
This will get a lot of use in this thread!
Thaks again Andy, the voice of reason and storehouse of information. (how do you pull out these references and articles?)
If you ever come to Vancouver I want to buy you a beer!
Exactly. I think your experiment is exageratig the effects. And then misrepresenting them. You make it sound like one cable is down 20DB at 20k compared to another, which is rubish. What your saying is people can hear the diference in less than .1 db of attenuation between 2 cable while te F response is almost identical. Im having trouble buying that.
The experiment is showing the actual magnitude of losses for all cables, and there is no exaggeration of any effects. Believe or not, losses in a high-quality cable can be 20dB lower than those in a low-cost one.
Here I’m showing how different cables can be, which is the point of my post.
Cheers,
R
With source and driving impedances, we can back into the DCR and equivalent inductance, then figure out what the actual frequency response variations at the termination will be. It won't be 20dB and I'll be surprised if it's 0.2dB.
Hi Passion. Thank you very much for your efforts here. I personally believe that ICs/Cabling do make a difference and have for several years based on my own personal listening experience. But I am curious - your chart appears to indicate a 20dB delta between cables across the frequency spectrum??? That seems pretty massive to me and not something that I have personally experienced. Can you help me understand more about how the 20dB could be for real? Again, keep in mind I am NOT a skeptic and I am very supportive of your work in this regard. I just want to make sure I am understanding what the data seems to be showing. Thank you very much.
Great stuff. Particularly this statement; "Similarly, anything that takes place inside the conductor such as boundries, grains, and all that junk are irrelevant, since any energy that enters the surface of the conductor is lost as heat anyway. ... it never again contributes to the information travelling along the axis of the conductor"
This will get a lot of use in this thread!
Yeah, that's a great explanation. Maxwell's equations only deal with macroscopic stuff. Typical manufacturers' claims about the microscopic things are just obfuscation.
As far as searching, I love the Google advanced search. I just did a search for "Essex" restricted to theaudiocritic.com. I couldn't remember how "yecch-o" was spelled 🙂.
Can you help me understand more about how the 20dB could be for real?
Remember, dB is always a relative measurement. If wire 1 has twice the series resistance as wire 2, one can say that wire 1 will drop 6dB more than wire 2, even if the actual delivered signal level variation is negligibly small (e.g., 0.01dB versus 0.2dB).
Cable tester
The source impedance is the output impedance of a typical opamp, so it's "low". Keep in mind that I'm measuring the cable losses relative to the input voltage, so any frequency response anomalies due to source impedance are eliminated.
Termination impedance is 10K for now, purely resistive, but it can be "anything" (within reasonable practical limits). R//C loads are not a problem.
Typical source voltage is 2V RMS, but can be lower if the noise floor in your test environment is not too high.
Cheers,
R
R, many thanks. Can you tell me the driving impedance and terminating impedance? Voltage level for the test?
The source impedance is the output impedance of a typical opamp, so it's "low". Keep in mind that I'm measuring the cable losses relative to the input voltage, so any frequency response anomalies due to source impedance are eliminated.
Termination impedance is 10K for now, purely resistive, but it can be "anything" (within reasonable practical limits). R//C loads are not a problem.
Typical source voltage is 2V RMS, but can be lower if the noise floor in your test environment is not too high.
Cheers,
R
If passion re-posts the graphs showing actual voltage levels I think it would be much clearer. (and plot the Vin Vout ) This will show that Vout will be Vin(1 voltish) +/- micro volts? for different cables.
Another way to put it; The relative levels show the resistance of the cable. If 1 is .ooo1 ohms and the other is .01 ohms thers 20 db difference but compared to a 10k input even 1 ohm or 40db will be inaudible.
Another way to put it; The relative levels show the resistance of the cable. If 1 is .ooo1 ohms and the other is .01 ohms thers 20 db difference but compared to a 10k input even 1 ohm or 40db will be inaudible.
- Status
- Not open for further replies.
- Home
- Design & Build
- Parts
- I don't believe cables make a difference, any input?