The shunt regulators (TL431) can't generate low Z, in undervoltage condition, but every supply can't grow more then 15V in any case, and also each supply is bypassed with 1000uF capacitor to the GND. Typically, in undervoltage condition onboard positive voltage is higher then the negative.I believe the shunt regulators also generate a virtual ground in Victor's design.
If the supply voltage is lower than what the shunt regulators are programed for
then what happens to the virtual ground? Can the shunts generate a low Z ground if the supply is not enough for them to function?
I adjusted David's Generator unit for more 2H and less 3H.... can be equal or less 2H and more 3H thd ..... So now the distortion harmonic level falls between -140 and -160dB. If adjusted for equal 2 and 3H level, both would be at approx -150dBv.
[This includes the analyzer non-linearity at these low levels. The Gen distortion harmonics are thus below -150.]

0 = -100dBV
THx-RNMarsh
[This includes the analyzer non-linearity at these low levels. The Gen distortion harmonics are thus below -150.]
0 = -100dBV
THx-RNMarsh
Last edited:
Which analyzer? As I remember the 725d increases the meter gain at the last step but not the output. I may have that confused with the other 725 variations.
You might try John Curl's trick of a cap across the oscillator to knock down the harmonics. -3 dB at fundamental, -6 dB at 2H and -12 dB at 3H. It would be a quick test to see if the limit is the source or the analyzer.
You might try John Curl's trick of a cap across the oscillator to knock down the harmonics. -3 dB at fundamental, -6 dB at 2H and -12 dB at 3H. It would be a quick test to see if the limit is the source or the analyzer.
Which analyzer? As I remember the 725d increases the meter gain at the last step but not the output. I may have that confused with the other 725 variations.
You might try John Curl's trick of a cap across the oscillator to knock down the harmonics. -3 dB at fundamental, -6 dB at 2H and -12 dB at 3H. It would be a quick test to see if the limit is the source or the analyzer.
Do add a 1k resistor in series with the output of the oscillator first. A cap directly on the output will probably increase the oscillator's distortion from loading.
I dont use the meter gain scale for -110. I force select the scale to be -100dB.
David is correct... the -110 fs has no affect on monitor output, only meter. Lowest scale for monitor out is -100dB.
The monitor out goes into FFT QA401.
-RNM
Demian, Dave, Dick I have a question about scaling on some of these plots. To me dBV is re:1V rms? so on that plot the noise floor at around -176dB with .182Hz BW and maybe a couple of db for the window function would imply ~2.5nV/rt-Hz. This does not seem reasonable to me for this oscillator considering the op-amp, resistors, and noise gain.
Demian, Dave, Dick I have a question about scaling on some of these plots. To me dBV is re:1V rms? so on that plot the noise floor at around -176dB with .182Hz BW and maybe a couple of db for the window function would imply ~2.5nV/rt-Hz. This does not seem reasonable to me for this oscillator considering the op-amp, resistors, and noise gain.
Scott the Shibasoku 725(B/C/D) normal monitor output is scaled to the full scale of the meter range in normal analyzer mode. The scale is different if the 725 is switched to analysis mode and the meter extra gain setting is active.
The meter FS corresponds to 1Vrms at the monitor output for any range.
If the ranges is set to 100dB then monitor output is 1Vrms at 100dB FS of the meter which for the FFT should read 0dB.
No the oscillator noise is certainly not 2.5nV/rtHz. The tuning resistors (Mdacs) alone have more noise than this and the op amp are around 5nV/rtHz. The 725 input amplifier add noise as well. Which is probably greater than 5nV/rt Hz. The multiplier add more noise than the resistor and op amp alone.
Consider the FFT software process. The noise is highly averaged. The FFT bandwidth is far far less than the noise BW of the oscillator.
If the the sample rate were increased to 192Hz the noise appears to be much higher.
I don't think we can go by the noise as it appears in FFT to assess the validity of the distortion levels. The longer the data set, (number of points ), is the lower the noise appears. So this is all artificial FFT BS but it doesn't change the distortion level.
If you want an idea of the system noise then do an analysis in the same BW in both THD and THD+N mode and subtract one form the other. What's left is the system noise,
both oscillator and 725.
The meter reading on the 725 is always correct to scale. This is done automatically by the 725 regardless of what appears at the monitor output.
The distortion levels Richard is showing here appears to be correct for 0dB = -100dB on the FFT scale. This is about the best the Shibasoku 725D can do. Who knows the oscillator distortion may be lower but must be validated by another method.
I can't expect distortion level from an oscillator to be any lower than what the amplifier are capable of. Some posts in this thread have left me scratching my head.
Last edited:

Scott:
My plots are scaled for the incoming signal. I try to note what level it is.
Getting these numbers correct is quite challenging. I usually use a 262144 point FFT and a 192 KHz sample rate. I think this gives a 192000/262144 = .732 Hz bin size. The effective bandwidth is also a function of the window (7 term hodie in this case) however I don't know how to go further with this. Sometimes I kick up to 512K or more but those take a long time and the analog sources drift enough to move to a different bin during the measurement.
The equivalent input noise of the 725 is around 4 nV/rtHz. I did confirm this at one point.
I usually make a point of scaling the plots so that 0dB is the full amplitude of the fundamental. (Praxis has a weighting function that makes this easy.) I would make no claims of noise floor from the plots but the spurs are probably accurate. Grounding is usually a PITA with many experiments to get the best results.
The other software (and the QA400-401) don't have the easy scaling options or some of the other features I use a lot. HPWworks might but I have not been able to go past the UI so far.
Usually I find some small mistake long after I make the measurement and need to start over.
I've done some tests with Shibasoku 725D to demonstrate the accuracy of the scaling in level and distortion mode.
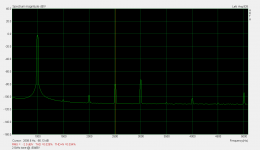
I've mixed a test tone at 2.5kHz with the oscillator. The oscillator level is 2.5Vrms. The test tone level is set to -80dBV. The level is taken in the 3Vrms (+10dBV) range on the 725D. The 725D meter is scaled such that at 3dBV FS of the meter the monitor output is 1Vrms (0dBV). 2.5Vrms then is exactly -2dB down from the meter FS and this is reflected correctly in ARTA. The RMS value of ARTA is -2.0dBV. The cursor in ARTA shows the level of the 2.5kHz test tone.
The test tone is generated from an HP625A and is mixed with the output of the SVO oscillator. This shown in the first pic.
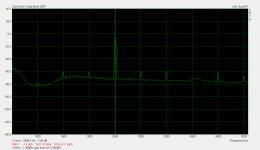
The 725D is switched from level mode to distortion mode. I've set the range of the 725D to 70dB so not to clip the input of the EMU0204. 70dB FS corresponds to 0dBV on the monitor output. In the 70dB range we expect the -80dBV test tone to read -10dBV on ARTA. The actual measurement is 7.36dBV. In the distortion mode there is a gain error of +2.64dBV. This is not in our favor.
This demonstrates the system scaling is correct from level mode to distortion mode and validates the 725D meter FS is 0dBV at the monitor output. The monitor output is scaled to the meter's FS in any ranges.
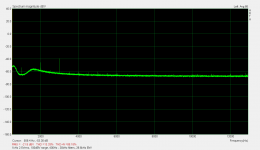
The first pic is level mode. The second pic is distortion mode and third pic is the distortion of the SVO at 2.5Vrms. I've set ARTA to plot linear scaling for clarity.
There is a difference between the residuals of this 725D in contrast to Richards 725D.
You can see the 2nd and 3rd harmonic are flipped. This is a s low as these two 725D can measure.
For the test tone tests the 725D filter are turned off.
In the distortion measurement the 30kHz and 400Hz filters are in. The input level is 2.5Vrms @ 1kHz. measured in the 100dB range. 0dBV on ARTA is -100dBV. The BW is 29.6kHz. FFT is 44.1kHz with 131072 points. 100k cycles of linear averaging.
I've mixed a test tone at 2.5kHz with the oscillator. The oscillator level is 2.5Vrms. The test tone level is set to -80dBV. The level is taken in the 3Vrms (+10dBV) range on the 725D. The 725D meter is scaled such that at 3dBV FS of the meter the monitor output is 1Vrms (0dBV). 2.5Vrms then is exactly -2dB down from the meter FS and this is reflected correctly in ARTA. The RMS value of ARTA is -2.0dBV. The cursor in ARTA shows the level of the 2.5kHz test tone.
The test tone is generated from an HP625A and is mixed with the output of the SVO oscillator. This shown in the first pic.
The 725D is switched from level mode to distortion mode. I've set the range of the 725D to 70dB so not to clip the input of the EMU0204. 70dB FS corresponds to 0dBV on the monitor output. In the 70dB range we expect the -80dBV test tone to read -10dBV on ARTA. The actual measurement is 7.36dBV. In the distortion mode there is a gain error of +2.64dBV. This is not in our favor.
This demonstrates the system scaling is correct from level mode to distortion mode and validates the 725D meter FS is 0dBV at the monitor output. The monitor output is scaled to the meter's FS in any ranges.
The first pic is level mode. The second pic is distortion mode and third pic is the distortion of the SVO at 2.5Vrms. I've set ARTA to plot linear scaling for clarity.
There is a difference between the residuals of this 725D in contrast to Richards 725D.
You can see the 2nd and 3rd harmonic are flipped. This is a s low as these two 725D can measure.
For the test tone tests the 725D filter are turned off.
In the distortion measurement the 30kHz and 400Hz filters are in. The input level is 2.5Vrms @ 1kHz. measured in the 100dB range. 0dBV on ARTA is -100dBV. The BW is 29.6kHz. FFT is 44.1kHz with 131072 points. 100k cycles of linear averaging.
Attachments
Last edited:
Consider the FFT software process. The noise is highly averaged. The FFT bandwidth is far far less than the noise BW of the oscillator.
No. No. No. Contrary to the popular belief, simple frequency domain averaging does NOT lower the noise floor. Synchronous averaging does, and this is normally accomplished by using signal triggered spectrum vector averaging (really, time domain averaging). Not sure if the QA has triggered averaging, I suppose not...
No. No. No. Contrary to the popular belief, simple frequency domain averaging does NOT lower the noise floor. Synchronous averaging does, and this is normally accomplished by using signal triggered spectrum vector averaging (really, time domain averaging). Not sure if the QA has triggered averaging, I suppose not...
QA tried that with melt noise. But it didn't work.
It took the distortion down as well.
However Shibasoku does do this in the THD analysis mode using synchronous sampling.
PL to the fundamental.
Last edited:
BTW --- The meter indicated THD+N with 2 volts rms input and 400hz-30KHz BW measured is -120dB
THx-Richard
using ShibaSoku 725D -
THD+N
Meter on -100dBv FS range:

and why meter reading cannot be used to measure the THD ... need to go to monitor output.
Meter on -110dBv = FS; is well below the scale reading of -130dBv

THx-RNMarsh
Last edited:
For GP panel meters maybe. But that would be really bad! I believe the spec for instrument is not of FS but of Reading. And it is to be within +/- 1dB for harmonic measurements. anyway ---
I just placed an accurate ac voltmeter to a variable output generator and set for 1v fs on 725D and then changed output level to 1/10 v on same scale. The 725D meter reading was less than one tick mark low of .1v on the volt scale. Or about 1/2db
THx-Richard
I just placed an accurate ac voltmeter to a variable output generator and set for 1v fs on 725D and then changed output level to 1/10 v on same scale. The 725D meter reading was less than one tick mark low of .1v on the volt scale. Or about 1/2db
THx-Richard
Last edited:
Well you can get lucky but you can't bet the farm on it. Did you check the spec in the manual? I have never seen it different than % of FS. Even the relatively expensive d'Arsonval movements themselves are often no better than 1.5% FSD.
Look in the left hand side of the meter: it says class 1.5 - 1.5% FSD accuracy. That's just the meter movement itself.
And it seems to me that one tick mark off at 0.1V is 10%.
Jan
Look in the left hand side of the meter: it says class 1.5 - 1.5% FSD accuracy. That's just the meter movement itself.
And it seems to me that one tick mark off at 0.1V is 10%.
Jan
Last edited:
using ShibaSoku 725D -
THD+N
Meter on -100dBv FS range:
View attachment 601180
and why meter reading cannot be used to measure the THD ... need to go to monitor output.
Meter on -110dBv = FS; is well below the scale reading of -130dBv
View attachment 601181
THx-RNMarsh
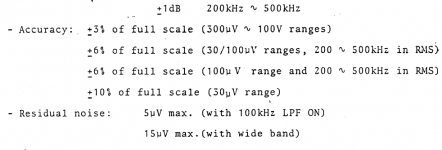
This why Shibasoku specifies 30% to 100% FS. We run out of dB. So have to calculate in % of FS. But what can we do? We have to take a reading.
I calculated the sum of the first 10 harmonics all at -150dBV. Came to -140dBV THD.
This is from the 725D operation manual.
This doesn't mean the meter is not accurate below specification. Shibasoku can't guarantee accuracy at these levels below the stated percent FS.
It means we have to do our due diligence to proved the measurement accuracy at these levels each and every measurement.
This doesn't mean the meter is not accurate below specification. Shibasoku can't guarantee accuracy at these levels below the stated percent FS.
It means we have to do our due diligence to proved the measurement accuracy at these levels each and every measurement.
Attachments
Last edited:
Thanks David.
BTW One more comment to the reading of d'Arsonval movements: the better ones, like those on the Shibasoku, have mirror scales. That means that the best accuracy is obtained when you read the meter such that the mirror image of the needle falls just behind the needle itself. In that case you are exactly perpendicular to the needle and the scale resulting in max accurate reading.
If you look at the pictures of the meters posted above you will see that the needle mirror image lies to the right of the needle itself and that therefor the apparent reading is too low. If you disregard that, it may easily give another 5 or 10% error at low readings.
Jan
- Home
- Design & Build
- Equipment & Tools
- Low-distortion Audio-range Oscillator