here you go
nc535 --
It seemed to work ok for me, but then the code I'm working with changes all the time. I just uploaded a version of what I have ATM --
http://libinst.com/Xsim/BetaTest/XSim3DSetup.exe
A few days ago I fixed a bug with doing copy&paste with a driver object, maybe that was what you ran into?
You should be able to put a measured on-axis "FRD" response for that driver into each of those drivers in your model. (though it would be easier to just start over, put the FRD into the first and copy it 24x, since I didn't put in a way to change all the drivers' parameters at the same time). BTW, your floor reflection setting has the array submerged into the floor -- the graphic isn't able to show that. Try raising the "target position above floor" so the lowest placed driver is above that.
I use C# in Visual Studio for my program and feel the same. My use is certainly not as extensive as yours is I'm sure, but the ease with which one can use complex data types really surprised me when I began.VB.Net is when the language really got good. That's when all of MS languages converged on the .Net platform with a common set of routines. Visual Studio is the best development platform that I have ever used and the fact that it can compile code written in VB, C#, C++, F#, FORTRAN, etc. makes it very flexible. It can use all these languages within a single app - use whatever language best suites the situation. I have written apps using VB, C++ and FORTRAN all in the same workspace and exe.
I wasn't aware that it can compile FORTRAN, do you have a specific extension added for that? Also, have you made any comparisons between the FORTRAN performance and VB.NET? Is it primarily to allow you to use existing FORTRAN that you had already coded?
Dave
nc535 --
A few days ago I fixed a bug with doing copy&paste with a driver object, maybe that was what you ran into?
You should be able to put a measured on-axis "FRD" response for that driver into each of those drivers in your model. (though it would be easier to just start over, put the FRD into the first and copy it 24x, since I didn't put in a way to change all the drivers' parameters at the same time). BTW, your floor reflection setting has the array submerged into the floor -- the graphic isn't able to show that. Try raising the "target position above floor" so the lowest placed driver is above that.
Thanks for the update-that was it.
Yes. I haven't quite grokked the target position controls yet and hadn't noticed that about the floor.
How do you establish the 0 point of the target vertical offset and of the baffle. I don't see any controls for moving the baffle up and down. My guess is that the zero of the target vertical offset is the center of the baffle and so I should have started placing my first driver there and then place the rest successively outwards from the center.
Have you noticed that small (.25") changes in driver offset make big changes in the HF combing/ripple. Is that expected?
Here is an updated 25 element line array file with the driver spacing matching the towers. OK, one more rev of the dxo file coming to get the drivers centered on the baffle.
I don't have an FRD for the TC9 but if someone will post or send me one I will incorporate it.
Attachments
I use C# in Visual Studio for my program and feel the same. My use is certainly not as extensive as yours is I'm sure, but the ease with which one can use complex data types really surprised me when I began.
I wasn't aware that it can compile FORTRAN, do you have a specific extension added for that? Also, have you made any comparisons between the FORTRAN performance and VB.NET? Is it primarily to allow you to use existing FORTRAN that you had already coded?
Dave
To run FORTRAN you have to have a compiler. I use the one from INTEL. I use FORTRAN because of its legacy, speed and capabilities. It can auto parallelize code, add, subtract, multiply and divide matrices of arbitrary size in a single line of code even with complex numbers. These days it is less and less advantageous because of INTELs Math Kernal Library (MKL), which is highly optimized for INTEL processors, but I still have tons of legacy code that is custom.
Why not start with import of various off axis measurements a la Kimmosto's VirtuixCad, instead of calculating off axis?
Visaton's BoxSim seems to work with these flat disk based calculations, invariably providing nothing but a bunch of of pretty pictures, looking to good to be true.
Visaton's BoxSim seems to work with these flat disk based calculations, invariably providing nothing but a bunch of of pretty pictures, looking to good to be true.
Why not start with import of various off axis measurements a la Kimmosto's VirtuixCad, instead of calculating off axis?
That is precisely what I do (albeit not with Kimmosto's VirtuixCad.) The issue becomes how many off axis results are required for say 2 degree of resolution. If one interpolates directly then it requires measurements at about every 4 degrees. My method expands the measurements into radiation modes and then reassembles them into a polar plot. This way I can get 2 degree resolution up to 10 kHz with only 13 (or less) measurement points.
Klippel does this in the near field and expands to the far field using a scanning array. I measure in the intermediate field as I don't have a scanning array (and I don't have $20,000 to buy a system from Klippel.) My system cost me maybe $200.
Off topic, but: by the time Bill Waslo is ready with this software update, his next diy job should the design of a low cost laser scanner plus associated software. Klippel on a shoestring.
As the man who gave the diy community IMP/M and LAUD, and now XSim is certainly up to that. If we all ask Bill kindly and humbly, he may be willing...
As the man who gave the diy community IMP/M and LAUD, and now XSim is certainly up to that. If we all ask Bill kindly and humbly, he may be willing...
Bill, I am not sure how accurate the assumption is that the off-axis radiation can be calculated from a piston source and an axial FRD. Have you looked at this? In my experience it is not really true because cone depth, breakup, etc. have major effects on this.
Earl, no I'm also pretty sure that there are inaccuracies with doing this. If nothing else, a resonance from a dust cap (for instance) would combine with resonances near the cone edge differently off axis simply due to time-of-flight delays. Resonances being geometrically locatable on different parts of a radiator would imply that on-axis mixed with the off-axis piston model won't be exact. But my simulation is meant to be only an approximation, i.e., not to be exact or cover all characteristics -- just to be something better than what is most often done in crossover design (i.e., pretend that only response on axis is important). It seems to me it would be better to have the driver response characteristics represented in off-axis simulations and reflection simulation even if not in proper proportion (or even if real ones would null out at some locations).
[edit: the use of the piston model is only for when off-axis measured data isn't available to the program (or for quick tests, such as when manufacturers don't provide any off-axis data). The intention is to support multiple off-axis frequency response file when they are provided to better simulate off-axis responses. Which is the reason for this forum thread, I was having difficulties figuring out a reasonable way to interpolate between responses]
Last edited:
Off topic, but: by the time Bill Waslo is ready with this software update, his next diy job should the design of a low cost laser scanner plus associated software. Klippel on a shoestring.
As the man who gave the diy community IMP/M and LAUD, and now XSim is certainly up to that. If we all ask Bill kindly and humbly, he may be willing...
Thanks Boden, but laser sensors, and in particular scanners, are a bit out of my abilities I think.
I did once try to make a laser vibrometer using a vertical cavity laser diode. I had run into a paper where someone did that, reading the voltage across the diode for the output, and using the current through the diode to vary wavelength for locking to a reflection sensing interference peak (to get around the very short sensing range and periodic nulls of the response otherwise). All I ever got was an outrageously sensitive but even more outrageously non-linear output signal -- you could see deflection of a wall when someone pressed a hand against it even from a significant distance away!
Off topic, but: by the time Bill Waslo is ready with this software update, his next diy job should the design of a low cost laser scanner plus associated software. Klippel on a shoestring.
As the man who gave the diy community IMP/M and LAUD, and now XSim is certainly up to that. If we all ask Bill kindly and humbly, he may be willing...
I see laser scanning as only useful to a driver manufacturer, not someone designing a system with off-the-shelf drivers as is done here virtually 100% of the time.
I would like to see Bill implement a polar plotting program for commercial use much like what I do on my web site. Make the software available and the ability to share the data files and I think that the industry would make great strides towards better loudspeaker systems. I have never done commercial software and don't feel competent to do so, but I would gladly turn over all of my techniques to Bill for his implementation so long as this became public domain - the software and data storage format, not the code. My techniques are exactly the same as Klippels, except that he does his in two angular dimension and I only do mine in one. That said, I know how to do it exactly like Klippel does. His system is about 20k$, so out of reach of any DIY.
With what I do one can also combine drivers through passive or electric networks (or both) and predict the complete polar response of a crossover at any frequency and any field location. I have been doing this for many years now, but since I no longer make speakers, I don't use that code anymore. I could not have made my speakers as good as they were without it. This is, I think, what Bill is trying to do. I don't include reflections, and I don't think that one should - it's the direct field that maters.
I run my system with a single mic and a wood rotating stand - cost; maybe $200 (mostly the mic and preamp.)
That's what I'd ask Bill to do.
Earl, why don't you release your crossover and off-axis design program? (I'm not really interested in starting over, this particular project is just hobby for me).
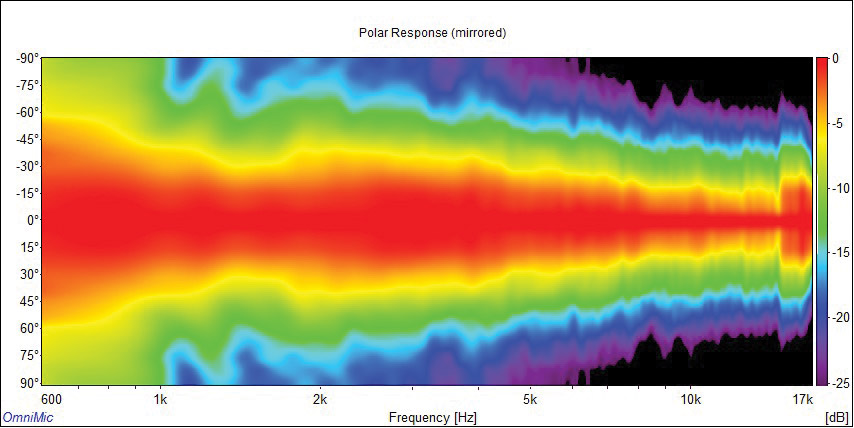
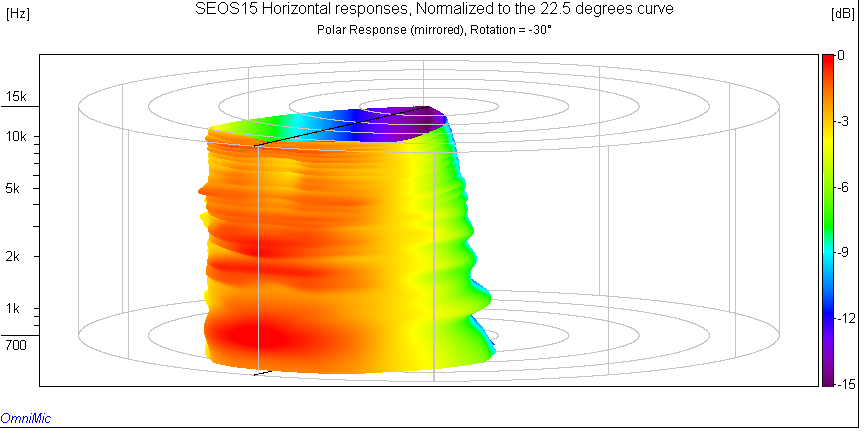
My OmniMic program, though (can be downloaded free from Parts Express, and can do all the viewing and processing steps without buying the mic) does polar plotting, similar but not the same as yours. People can just feed it a series of FRD files with the angle given within the filename and it will do colored directivity diagrams in several forms.
My OmniMic program, though (can be downloaded free from Parts Express, and can do all the viewing and processing steps without buying the mic) does polar plotting, similar but not the same as yours. People can just feed it a series of FRD files with the angle given within the filename and it will do colored directivity diagrams in several forms.
Attachments

Releasing my program is not feasible. I only ever run it in Visual Studio because being in several languages it needs lots of DLLs to run. Visual Studio knows where all these are so it easy and you can just blow past errors in the debugger. A stand alone executable is not possible and making an installation program is a more of a PITA than I am interested in doing. It is also so complex to run that it would require a manual to decipher and then it is very buggy.
Can your program export a single file that has all frequencies, at all angles and the DI and power responses? To me that is a minimum. If this is all in a single file, then people could share this data. A polar plot is nice, but its not all the info that one needs. You need the DI and power response (even Toole/Olive agree with that) and since the DI is always relative to the axis under consideration, this is a dynamic thing not a static one.
I totally agree with you that doing a crossover for a single axis is far from ideal. But there isn't anything out there that can do anything else. I thought that this would be useful.
If I were a better programmer perhaps I would create a useful program, but I am a hack. I can write code that suites my needs, but no one else would find it appealing.
Last edited:
My OmniMic program, though (can be downloaded free from Parts Express, and can do all the viewing and processing steps without buying the mic) does polar plotting, similar but not the same as yours. People can just feed it a series of FRD files with the angle given within the filename and it will do colored directivity diagrams in several forms.
Unrelated to the thread topic (I don't have the technical competence to help, sorry) but related to the above: I bought the Omnimic package solely for the polar plotting function in the software; I prefer other programs for measurement. However, I wish there was more control over the polar map display, just as there is over the standard window: flexible; changes to the color scheme and y-axis scaling, and block color (i.e. +3 to 0 dB white, 0 to -3dB red, -3 to -6 dB yellow, etc) rather than gradient. That would be a great addition for a future update.
Last edited:
Just trying to remind the past dozen or so posts that Bill didn't want scope creep. ")
Bill -- where are you in terms of hang-ups presently? I know you asked for some follow up questions of me that I'll need to sit down with some paper/pencil to be of use, and not sure if you've moved past them yet.
Bill -- where are you in terms of hang-ups presently? I know you asked for some follow up questions of me that I'll need to sit down with some paper/pencil to be of use, and not sure if you've moved past them yet.
Bill
One last idea that you might want to try. In rectangular coordinates, any distribution of velocity in that plane will yield a directivity function (physicists call it k-space) that is simply the 2-d Fourier transform of the velocity distribution. If the V(x,y) is limited to a rectangle then it becomes a finite Fourier Series in Sines and Cosines. Of course you can't define a circle in this space, but a square is easy.
It is also possible to do the same problem in polar coordinates, but this then becomes a Bessel Transform which are hardly known and not readily available. In polar coordinates the problem is identical to the lens problem and can be found in texts on Fourier Optics like the superb one by J.W.Goodman.
Earl, thanks. A bit over my head (without some further reading and study, at least), but worth looking into. I'd seen mention of the 3D FT relationship.
DPH, thanks also -- At present I think I have an approach that will should give results that at least aren't contradictory with the simple test case.
So I think I'm good to proceed. Right now my hangup (not really a hangup, but a job I'm needing to spend time on) is library organization -- how to search through frd filenames in a set of off-axis measurements and decide when to assume symmetry of some kind, without requiring the user to fill out a vast specification form. And how to organize the data arrays in memory for efficient parsing.
- Status
- This old topic is closed. If you want to reopen this topic, contact a moderator using the "Report Post" button.
- Home
- Design & Build
- Software Tools
- Xsim-3D development... I could use some math help