Because a driver isn't a flat resistive load and has a different impedance at different frequencies...Why does the wizard require a ZL value for a passive low pass?
Shouldn't ZL be derived by the imported impedance data ?
The filter calculation can only be correct for one load impedance but a drivers impedance varies with frequency - how would the program know what frequency to use as a representative frequency for a driver ?
Also, what if you have a zobel network - now the filter doesn't "see" the raw impedance of the driver but a highly modified one that (hopefully) looks flatter.
In short its up to the designer to choose what impedance the filter is calculated for, understanding the effects that the varying impedance of the driver will have on the result.
The filter wizards are only convenient starting points - any real crossover with imperfect drivers will require further hand optimisation of individual values to give the desired response, partly due to interaction between different sections in passive designs and partly due to non-flat impedance of the drivers.
Last edited:
Thanks. However I disagree.
We are talking about something named a "wizard", not textbook values suggestion.
A "wizard" could probably be more true to the name if it would use the impedance real value at cutoff frequency, at least as an option, and consider all added networks e.g. a zobel to suggest values that would bring the response as close as possible to the target slope.
Otherwise a less fancy name is probably more appropriate in my opinion
You miss the point of what I'm saying.Thanks. However I disagree.
We are talking about something named a "wizard", not textbook values suggestion.
A "wizard" could probably be more true to the name if it would use the impedance real value at cutoff frequency, at least as an option, and consider all added networks e.g. a zobel to suggest values that would bring the response as close as possible to the target slope.
Otherwise a less fancy name is probably more appropriate in my opinion
It's not just a matter of finding the impedance at the cutoff frequency of the filter and using that, it's the fact that it's not even possible to achieve some target responses with an uncorrected speaker impedance with a simple filter, or even at all. There's more to a filter than its cutoff frequency...
For example a woofer with a high inductance - if you try to design a textbook 1st order low pass filter for it consisting of only a series coil - you will not get anything resembling a 1st order electrical roll off - in fact it will look more like a high cut shelving response...
So having the program determine what the woofers impedance is at the "cutoff" frequency of the filter does not help make the resulting filters response resemble what you ask for.
With higher order filters you can come closer to achieving the target cutoff frequency and final slope without impedance correction but it will still have the wrong response shape.
A second order filter with no zobel will not produce a textbook electrical response no matter what values of L & C you use. (A more complex filter would be required to achieve the second order response) So why pretend to do what you can't ?
If a speaker was just a coil in series with a resistance as it is usually represented it would be easier to achieve target slopes of higher order filters without a zobel by including the speaker impedance as part of the filter, however the inductance of the speaker is "lossy" so you do not actually see the same degree of impedance rise that you would see with an actual resistor and coil of the same value - typically about half as much.
This makes including the impedance of the driver as part of the filter to achieve a target response more difficult, and I prefer not to do it this way.
Another reason not to is that any woofer / midbass driver without a shorting ring will suffer from inductance modulation with excursion, which can cause large changes in the impedance near the crossover frequency with cone excursion resulting in large dynamic variations in the crossover response with bass, resulting in a form of inter-modulation distortion. Better to swamp the high impedance of the driver at high frequencies with a zobel which results in a more stable load for the filter.
IMHO what you're asking for is outside the scope of what VCAD offers with its filter block approach - it is a modelling tool that you can use to create a design, simulate it, and rapidly iterate the design, it does not do the filter design and optimisation work for you to meet a specific target - there are other packages that will do that, but none I'm aware of that are free...
Last edited:
Otherwise a less fancy name is probably more appropriate in my opinion
I can rename it as Stupid textbook reader if Wizard is too fancy. As DB tried to explain, optimizing in impedance domain is simply bad decision because acoustical response is what finally matters. In addition, looking for Z of single driver is not enough because there could be multiple drivers, series networks for individual drivers and other components in common network before Wizard is engaged.
You can optimize LP/HP filter created with this 1st class wizard by adjusting ZL and f with mouse wheel after filter is created. Just click the first block of the LP/HP group (Replace mode), start wheeling, adjust acoustical response close to target and finalize manually.
Adjusting acoustical responses to target is iterating optimization - not a Wizard.
Last edited:
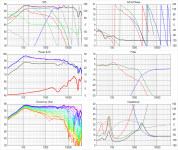
About SPL Trace.
I have made test revision 1.1.18.0 (click to download) including:
- Internal frequency range of 10 Hz...40 kHz, 48 points/oct = 575 points. Applies to whole program package.
- Selection of export density in Options menu of SPL Trace: 48, 24 or 12 pts/oct. Smoothing is checked automatically if 24 or 12 pts/oct is selected.
- Smoothing 1/12 oct moved to Options menu.
Few opinions.
LspCAD and other simulators have nothing to do with this truncated range issue/requirement. Designer should be aware of driver's behavior but axial sound pressure above 22 kHz is not valuable to know exactly while optimizing whole output (including directivity and power) of speaker with simulator.
Wider internal range causes unnecessary extrapolation at high freq. That could confuse auto scaling of SPL charts and 95% of users. Possible problems with auto scaling can be avoided by limiting visible range, but I cannot give any guarantee if any response in polar response set has steep jump just before measured range ends. That is quite common event.
Mic manufacturer should be able to deliver cal-file in electrical format. Producing of cal-file with less than 100 points is much easier and faster with text editor than making program changes that can do such conveniently inaccurate capturing automatically.
Normally I don't make this kind of changes for few individuals because of risk that other users (including myself) suffer.
Test revision 1.1.18.0 just updated (click to download).
Extrapolation caused some troubles with off-axis responses. Range for slope detection at high end increased from 1/3 octaves to 1 octave. Now it's more stable but insensitive if response starts to drop close to high limit of measured range.
Please report if any problems with extrapolation due to extended internal frequency range. Users who don't care about 40 kHz limit should also test with own projects because this change will not end up to official release if causes more trouble than benefit.
^Paths are relative below the directory where vxp file is located. That allows simple copy to another drive or user. For example:
user\Documents\VituixCAD\Projects\KS-102, location of KS-102.vxp and it's variations.
user\Documents\VituixCAD\Projects\KS-102\Far, far field measurements
user\Documents\VituixCAD\Projects\KS-102\Near, near field measurements
user\Documents\VituixCAD\Projects\KS-102\Impedance, impedance measurements
user\Documents\VituixCAD\Projects\KS-102\Merger, merged LF+HF responses
user\Documents\VituixCAD\Projects\KS-102\Diffraction, baffle and directivity simulations
and so on...
Last edited:
Some sample projects where I have originally measured the extended range. Seem to show up as intended. On the second sample I guess I did use some process that limits the data above 22k for off axis curves, but the VCAD appears to handle it quite gracefully.
But I do agree that for 'normal crossover work' this extended range is not really necessary. Seeing the tweeter resonance like the Seas coax shows on sample is best hidden anyway. So this extension of range really should be used only if there is some very special reason to do so.
Thanks Kimmo for doing the effort!
Attachments
Ah so it does for FR but I don't think it does for the impedance measurement, this looks like it uses the original absolute path (i.e. if I move a vxp without the data files then it complains about the FR files not existing but the zma is still shown and references the original path)^Paths are relative below the directory where vxp file is located. That allows simple copy to another drive or user. For example:
user\Documents\VituixCAD\Projects\KS-102, location of KS-102.vxp and it's variations.
user\Documents\VituixCAD\Projects\KS-102\Far, far field measurements
user\Documents\VituixCAD\Projects\KS-102\Near, near field measurements
user\Documents\VituixCAD\Projects\KS-102\Impedance, impedance measurements
user\Documents\VituixCAD\Projects\KS-102\Merger, merged LF+HF responses
user\Documents\VituixCAD\Projects\KS-102\Diffraction, baffle and directivity simulations
and so on...
Hi kimmosto,
first I want to thank you very much for this really genius piece of software you wrote!
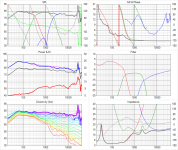
There is one issue which sometimes makes working with it harder: It is the auto scale function for the Y-axis (Level in dB) in the Power & DI graph. Sometimes it is scaling wrong so the curves go out of sight. Changing the Span sometimes helps, but not always and of course with lowered 'resolution'.
I would be very happy if there would be -for example- a possibility to turn of the auto scale function and only have some fixed numbers there.
Best Regards
first I want to thank you very much for this really genius piece of software you wrote!
There is one issue which sometimes makes working with it harder: It is the auto scale function for the Y-axis (Level in dB) in the Power & DI graph. Sometimes it is scaling wrong so the curves go out of sight. Changing the Span sometimes helps, but not always and of course with lowered 'resolution'.
I would be very happy if there would be -for example- a possibility to turn of the auto scale function and only have some fixed numbers there.
Best Regards
There is one issue..
I have seen your simulations with this issue on German forum. Some of your response files are corrupted for sure. Auto scaling works very good with valid data.
There must be random peak somewhere within 10Hz...22kHz. Peaking frequency can be revealed by maximizing program window to full screen and then zooming SPL chart with double click. Then use text editor to fix corrupted frequency point in response file. You can delete whole line because program interpolates missing bands.
Another option is smoothing all responses with Calculator tool (select Scale function and smoothing of 1/12 oct). Smoothing cannot fix extremely bad corruption.
I will not make scale locking or manual scaling if single...few users encounters problems due to corrupted files.
Thank you very much for your answer, kimmosto.
This helped me out, I used simulated data from ABEC and there was a peak above 20k >10dB higher than the rest.
Unfortunately this may also happen in "real life", for example with metal or ceramic cones and domes. And I, personally, don't like the idea to rework evident resonance peaks just to have a better view, because the software wants to tell me what I have to see and what not")
Nevertheless, thank you again very much for all your work and effort so far!
"I will not change XY because of only one single or few people" - preventing very good stuff to become brilliant stuff..for ever
This helped me out, I used simulated data from ABEC and there was a peak above 20k >10dB higher than the rest.
Unfortunately this may also happen in "real life", for example with metal or ceramic cones and domes. And I, personally, don't like the idea to rework evident resonance peaks just to have a better view, because the software wants to tell me what I have to see and what not
Nevertheless, thank you again very much for all your work and effort so far!
"I will not change XY because of only one single or few people" - preventing very good stuff to become brilliant stuff..for ever
Unfortunately this may also happen in "real life", for example with metal or ceramic cones..
Correct, but you can still eliminate the issue by limiting displayed frequency range up to 20 kHz or even less if the peak is very close to 20k. What I cannot totally control is that .NET engine hides very fast/dense jumps in graphic lines. It's quite annoying feature - especially in Impulse response window. This is the reason why chart should be zoomed to reveal the problem.
"I will not change XY because of only one single or few people" - preventing very good stuff to become brilliant stuff..for ever
My job is to verify that limiting of visible frequency range really works for this issue, and fix the program if needed. But I will not take steps back because auto scaling is usually stable, flexible within -150...+200 dB range and very easy to use. It can also eliminate scale jumping with some hysteresis while tuning crossover.
Manual span and max adjustment is implemented in some other places e.g. in Calculator. It is doable but would make main program less brilliant, imo
My job is to verify that limiting of visible frequency range really works for this issue, and fix the program if needed.
This is done in rev. 1.1.18.2
- Home
- Design & Build
- Software Tools
- VituixCAD