Makes sense. I will try it, hopefully I will understand it too, eventually.You need full set of off-axis data for any off-axis simulation. Check "directivity" box in diffraction tool for full set of data. Just keep in mind that it uses a basic piston model for calculation and lacks accuracy for high frequencies, so real world result may be quite different.
Is this a single full range driver or is it a part of a larger configuration?a non-standard configuration.
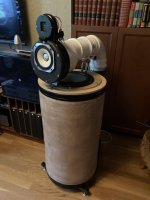
My contraption looks like this. It works very well, and I am trying to understand why.
The low end is a ceramic 70 liter flower/treepot, a more practical solution than concrete when you want to avoid enclosure sidewall emission.
The driver is a 10-inch SEAS H1411_A26RE4, I choose to use a CB enclosure Q≤0.71 because I wanted to avoid resonant components.
The higher end is a Fostex FX120 mounted to a 1.5 meter long drain pipe, commercial brand name "Uponor DECIBEL" intended to reduce flush noise in indoor plumbing. Thicker walls and a special polymer mix with high damping, works very well for my purposes. The pipe is closed and well damped for the same reasons as for the low end, I wanted to achieve a non-resonant "infinitely long transmission line". Not completely successful but it works ok.
On top of this is a Dayton AMT-2 with a series cap of 1 uF only, first order high pass, simply adding to the roll off of the full range driver.
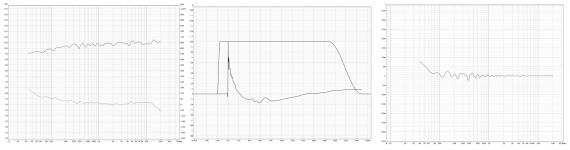
It might be obvious to anyone that my prime objective is to make a system with a "perfect" time coherent step response, and I am driving this with a DSP phase linear Linkwitz-Riley FIR crossover filter, dividing at 240Hz. I am more or less happy with the result, if the time coherent step response is audible and important could be anyone's guess. Science says it is not important but I wanted to try it anyway.
My main simulation workhorse has been lspCad, but this is now quite old and does not work well with off-axis configurations, this is why am now trying to learn and understand VituixCad. I use REW for measurements, and I cannot say I have any expertise there either.
A few more VituixCad questions:
Can the room response be smoothed? It is usually too wild to give any useful information when correlating to the listening impression. Or actually, too much information..
Are the main SPL graphs in the tab "crossover" always free space? My outdoor measurements look a bit like the simulated SPL I get for best step response, the low end is about 6-10dB less than the midrange. This is still working well in the listening room, and I can imagine that a flat free space SPL in my room would be a disaster.
The manual is a bit thin on 2pi and 4pi conditions, and what it really means. I have the impression that 2pi SPL export is removing the diffraction effects completely. The enclosure export of diffracted SPL is not even mentioned in the manual. If it is I have missed it.
[Edit: I should have mentioned that this design is OBVIOUSLY inspired by Linkwitzlab PLUTO, and the detailed description of this system has been very useful to me. However, this implementation is very different in the details, I hope I will not be accused of infringement. My design will not be commercialised.]
The low end is a ceramic 70 liter flower/treepot, a more practical solution than concrete when you want to avoid enclosure sidewall emission.
The driver is a 10-inch SEAS H1411_A26RE4, I choose to use a CB enclosure Q≤0.71 because I wanted to avoid resonant components.
The higher end is a Fostex FX120 mounted to a 1.5 meter long drain pipe, commercial brand name "Uponor DECIBEL" intended to reduce flush noise in indoor plumbing. Thicker walls and a special polymer mix with high damping, works very well for my purposes. The pipe is closed and well damped for the same reasons as for the low end, I wanted to achieve a non-resonant "infinitely long transmission line". Not completely successful but it works ok.
On top of this is a Dayton AMT-2 with a series cap of 1 uF only, first order high pass, simply adding to the roll off of the full range driver.
It might be obvious to anyone that my prime objective is to make a system with a "perfect" time coherent step response, and I am driving this with a DSP phase linear Linkwitz-Riley FIR crossover filter, dividing at 240Hz. I am more or less happy with the result, if the time coherent step response is audible and important could be anyone's guess. Science says it is not important but I wanted to try it anyway.
My main simulation workhorse has been lspCad, but this is now quite old and does not work well with off-axis configurations, this is why am now trying to learn and understand VituixCad. I use REW for measurements, and I cannot say I have any expertise there either.
A few more VituixCad questions:
Can the room response be smoothed? It is usually too wild to give any useful information when correlating to the listening impression. Or actually, too much information..
Are the main SPL graphs in the tab "crossover" always free space? My outdoor measurements look a bit like the simulated SPL I get for best step response, the low end is about 6-10dB less than the midrange. This is still working well in the listening room, and I can imagine that a flat free space SPL in my room would be a disaster.
The manual is a bit thin on 2pi and 4pi conditions, and what it really means. I have the impression that 2pi SPL export is removing the diffraction effects completely. The enclosure export of diffracted SPL is not even mentioned in the manual. If it is I have missed it.
[Edit: I should have mentioned that this design is OBVIOUSLY inspired by Linkwitzlab PLUTO, and the detailed description of this system has been very useful to me. However, this implementation is very different in the details, I hope I will not be accused of infringement. My design will not be commercialised.]
Attachments
Last edited:
To simulate this properly with any capable simulator, you may have to break the process up into several steps and take things under manual control. Vituixcad would have the tools to help you in these stages, it's just that the standard development process may not suit the configuration and you may want to do some hand holding.
The differences will be that if you measure an up firing driver from the side of the speaker in a standard H&V style, the weighting will not be correct. If you measure it from the top, the angular selector in VC will not correspond. And if you simulate it as a front firing driver, the responses won't correspond to the angles.
But it's all possible. May I suggest you consider the original intent of the configuration and don't forget that the reflections are going to be significant in nature and level compared to the direct, and can't be left out.
Weighting of reflections like this is not really a feature of simulators in general and you may need to experiment, or take it to independent research. With a design like this it may be helpful to look at what Siegfried Linkwitz had to say about it.
Thanks for the info. Please explain the meaning of the term "weighting", I am not 100% familiar with the audio science terminology. I have been a hobbyist for 30 odd years, but I am still learning.
Please see my edit of the last post, regarding the reference to Siegfried Linkwitz.
Please see my edit of the last post, regarding the reference to Siegfried Linkwitz.
Example in the third post in this thread. Using the term in relation to conventional H&V frontal measurements of an up firing system.. If you take a set of horizontals from out in front of the fullrange driver, when measuring the woofer, you'll get a set of 90 degree shots of it, which won't be too helpful. With a front facing speaker, the outer measurements are covered more heavily because they cover more area, but in this case it doesn't target the issue. The fact that a measurement scheme has shape and direction says something about what it has been designed to measure.
With normal configurations this measurement scheme does do a satisfactory job. If this seems complicated I'd suggest you look at the job the speaker is meant to do. It is an unusual configuration. Furthermore it is dependent on reflections.
With normal configurations this measurement scheme does do a satisfactory job. If this seems complicated I'd suggest you look at the job the speaker is meant to do. It is an unusual configuration. Furthermore it is dependent on reflections.
Member
Joined 2003
Room tab is the least useful part of VituixCAD. It only highlights obvious reflection locations based on speaker and listener positions. For this information I would recommend REW room sim over VituixCAD.A few more VituixCad questions:
Can the room response be smoothed? It is usually too wild to give any useful information when correlating to the listening impression. Or actually, too much information..
For useful information relating to listening impression, power & DI chart is the most useful tool. It provides response result following CTA-2034 standard, but will not be a calculated result, for accuracy you must provide the software with real measurement data, follow the process outlined in "How to start working with VituixCAD" in the help file.
CTA-2034 standard and other supporting documents can be found in the links I posted in post 8.
SPL graph is whatever the data you provide it. For loudspeaker design, free-space is the preferable method since room in unknown, unless speaker is going to be a permanent installation. Of course, free-space response can be created in-room, you don't need to go outside. See the measurement guides for more detail.Are the main SPL graphs in the tab "crossover" always free space? My outdoor measurements look a bit like the simulated SPL I get for best step response, the low end is about 6-10dB less than the midrange. This is still working well in the listening room, and I can imagine that a flat free space SPL in my room would be a disaster.
The main problem right now is that you are trying to simulate complex conditions with very limited information. Results will be inaccurate at best. It sounds like you have a mic and the speaker is already built so my suggestion would be to utilize it as much as possible for analysis of real world conditions.
2pi is nearfield or "infinite baffle" result, enclosure data is 2pi result.The manual is a bit thin on 2pi and 4pi conditions, and what it really means. I have the impression that 2pi SPL export is removing the diffraction effects completely. The enclosure export of diffracted SPL is not even mentioned in the manual. If it is I have missed it.
4pi is far field including baffle diffraction/ "baffle step".
If you have multiple measurements and average them together, each measurement will be averaged with equal "weight". Adjustment of weighting simply means the impact each response has on the averaged result, for example forward facing response is of higher weight than response at 90 degrees to the listener.Thanks for the info. Please explain the meaning of the term "weighting", I am not 100% familiar with the audio science terminology. I have been a hobbyist for 30 odd years, but I am still learning.
Please see my edit of the last post, regarding the reference to Siegfried Linkwitz.
Member
Joined 2003
Can we keep this thread focused on the use of VituixCAD? Have you used it?To simulate this properly with any capable simulator, you may have to break the process up into several steps and take things under manual control. Vituixcad would have the tools to help you in these stages, it's just that the standard development process may not suit the configuration and you may want to do some hand holding.
The differences will be that if you measure an up firing driver from the side of the speaker in a standard H&V style, the weighting will not be correct. If you measure it from the top, the angular selector in VC will not correspond. And if you simulate it as a front firing driver, the responses won't correspond to the angles.
But it's all possible. May I suggest you consider the original intent of the configuration and don't forget that the reflections are going to be significant in nature and level compared to the direct, and can't be left out.
Weighting of reflections like this is not really a feature of simulators in general and you may need to experiment, or take it to independent research. With a design like this it may be helpful to look at what Siegfried Linkwitz had to say about it.
I don't agree with your opinions on "weighting" in relation to speaker type. CTA-2034 is designed for presenting power & DI for a speaker in typical room in relation to a listener at 2m+ distance. It does not matter is speaker is monopole, dipole, omni, etc. Weighting of response pointing at ceiling is automatically increased from amplitude of measured response.
Can you provide some real-world data to support your claim other than the basic graphic in post 3?
Here's LXMini Klippel testing with CTA-2034 chart, is it a flawed chart?
https://www.erinsaudiocorner.com/loudspeakers/linkwitz_lx_mini/
Here some words that hopefully help to figure out what you should do, give confidence do what you need to do ")
VituixCAD visualizes audio measurement (sets) one feeds into it. All the tools menu stuff help to make/prepare/manipulate measurements. All the main window functionality, graphs, visualize the measurements.
Measurements can be real or virtual. VituixCAD diffraction tool can make simple measurement sets but it doesn't model objects fully, its just baffle edge simulation. Full 3D object measurements can be produced with BEM simulation like ABEC for example).
Its the operators responsibility to generate measurements somehow, and know how its fed into the simulator so that it represents reality, or something else one wamts to inspect Its operators responsibility to interpret the visuals so that it helps in the design process, or whaever one is doing, what you want to see from the data.
VituisCAD measurement documents explain basic procedure how to make a crossover for a readybuilt speaker, how to take measurements at home and how to feed them into the simulator and simulate a crossover for it.
When working outside this basic scenario it can be bit overwhelming, kind of "what should I do next" and "what am I doing actually" stuff in mind VituixCAD is very powerful, can visualize almost anything you want to see, just figure out what data you should put in, how to produce (and manipulate) that data in order to see what you want to see.
Want to see response of upward firing woofer? messure it and feed it and thats it. Want to see the data from another observation point than the microphone was in? manipulate the coordinates and tilt. Coordinates move the measurement set loaded to the driver in relation to origo, 0.0.0. All graphs show response listening distance away from the origo.
So, is graphs showing 2pi or 4pi response? answer is it shows your measurements.
Another Q: How to simulate upward firing woofer? A: You could measure from listening spot (axis). woofer firing up, load into simulator and there it is. Or measure from front of the driver and then tilt the responses 90deg up in simulator (driver coordinates tilt). If you think where the actual measured responses were taken, depending on settings on the simulator (like reference angle and some tilt and Y coordinate shanged) then graphs might show response at observation point where there is no real measurements but interpolated from the closest actual H&V measurements you fed in.
Graphs show what you feed in and rest is interpolated, you analyze the graphs and do what you have to do, build crossover or build another construct or what ever it is you were set out doing.
VituixCAD visualizes audio measurement (sets) one feeds into it. All the tools menu stuff help to make/prepare/manipulate measurements. All the main window functionality, graphs, visualize the measurements.
Measurements can be real or virtual. VituixCAD diffraction tool can make simple measurement sets but it doesn't model objects fully, its just baffle edge simulation. Full 3D object measurements can be produced with BEM simulation like ABEC for example).
Its the operators responsibility to generate measurements somehow, and know how its fed into the simulator so that it represents reality, or something else one wamts to inspect
Its operators responsibility to interpret the visuals so that it helps in the design process, or whaever one is doing, what you want to see from the data.VituisCAD measurement documents explain basic procedure how to make a crossover for a readybuilt speaker, how to take measurements at home and how to feed them into the simulator and simulate a crossover for it.
When working outside this basic scenario it can be bit overwhelming, kind of "what should I do next" and "what am I doing actually" stuff in mind
VituixCAD is very powerful, can visualize almost anything you want to see, just figure out what data you should put in, how to produce (and manipulate) that data in order to see what you want to see.Want to see response of upward firing woofer? messure it and feed it and thats it. Want to see the data from another observation point than the microphone was in? manipulate the coordinates and tilt. Coordinates move the measurement set loaded to the driver in relation to origo, 0.0.0. All graphs show response listening distance away from the origo.
So, is graphs showing 2pi or 4pi response? answer is it shows your measurements.
Another Q: How to simulate upward firing woofer? A: You could measure from listening spot (axis). woofer firing up, load into simulator and there it is. Or measure from front of the driver and then tilt the responses 90deg up in simulator (driver coordinates tilt). If you think where the actual measured responses were taken, depending on settings on the simulator (like reference angle and some tilt and Y coordinate shanged) then graphs might show response at observation point where there is no real measurements but interpolated from the closest actual H&V measurements you fed in.
Graphs show what you feed in and rest is interpolated, you analyze the graphs and do what you have to do, build crossover or build another construct or what ever it is you were set out doing.
Last edited:
Member
Joined 2003
Hi Allen.Calculate the distance to the baffle at each driver height during the measurement (the baffle is the common element here), and work out the difference between woofer and tweeter. Then we do the same for the listening position.
If there's a difference in acoustic distance between the woofer and tweeter, then it's already in the measurement. We are not presently looking at that... only the difference between the differences in baffle distances between the listening position and the measurement position.
SQR(((900-1172)^2)+(1000^2))
= 1036mm
SQR(((900-854)^2)+(1000^2))
= 1001mm
The difference is 35mm.
>Now, with the listening distance and the listening height we can do the same thing for the listening position and compare the difference.
>Then discuss how to use it.
I have already done these calcs (didn't realise the calcs you meant).
However I added the distance from the baffle face to the estimated acoustic centre of each driver to the 1000mm distance.
Should I have done that or not?
It added 27mm to the "tweeter" (this is larger than expected because the tweeter is mounted on the rear of the 18mm thick baffle).
And added 40mm to the 8" woofer.
This meant that the two measurement calculations you suggested now end up as 1062mm and 1041mm; giving a difference of 21mm.
Applying the same maths to my listening position of 900mm above the floor, and 2400mm from the baffle (and adding the 27mm and 40mm),
the two distances are 2442 (tweeter) and 2440 (woofer). A difference of 2mm.
But if I shouldn't be adding the distance from the baffle to the estimated acoustic centre, then the two listening distances respectively are 2415 (tweeter) and 2400 (woofer). A difference of 15mm.
Ok, that looks good... except it's not necessary to add the extra acoustic centre distances. That amount is in the measurement. When you accept that amount together with the 'additional' geometric distance difference, you'll have the right listening position delay.
Once you have that amount you can either add the 'additional' delay to the REW measurements, which will sim well... or you can use the features of the simulator to create the delay for you.
If you do it by adding the additional delay to REW, only adjust the measurements of one driver where you can push the left window further left. The reason is that if you push the left window right on the other driver instead, you may begin to encroach on the impulse, but moving the left window left just adds empty space.
Member
Joined 2003
It is good because the different acoustic delays on all axes are safely stored in the axial measurements... while the baffle stayed at a constant 1m for all of them.Adding delay is bandaid fix for only delay, not the fact that entire measurement data set is off axis…
Member
Joined 2003
If all you care about is delay… “on axis” frequency response measured 15 deg below driver axis is still wrong response, top frequencies of entire tweeter data will be droopy. Fixing delay for on axis and then adjusting y dimensions to place listener below driver axis in software is doubling down on off-axis error.
Last edited:
OK.Ok, that looks good... except it's not necessary to add the extra acoustic centre distances. That amount is in the measurement. When you accept that amount together with the 'additional' geometric distance difference, you'll have the right listening position delay.
Once you have that amount you can either add the 'additional' delay to the REW measurements, which will sim well... or you can use the features of the simulator to create the delay for you.
If you do it by adding the additional delay to REW, only adjust the measurements of one driver where you can push the left window further left. The reason is that if you push the left window right on the other driver instead, you may begin to encroach on the impulse, but moving the left window left just adds empty space.
At 1000mm, difference between drivers is 35mm (tweeter further away).
At 2400mm, difference between drivers is 15mm (tweeter further away).
If I was going to do all the measurements again (on each driver's axis), I would make the adjustments in REW.
But if I don't re-measure, and make the adjustments in VituixCAD, then do I set the woofer driver delay to 0, and the tweeter (further away) to -(35-15) = -20mm, i.e. -58us?
Once Christmas over (and the relations have gone), I will probably make the effort and take all my measurements again - especially if I can get my head around timing/delay.If all you care about is delay… “on axis” frequency response measured 15 deg below driver axis is still wrong response, top frequencies of entire tweeter data will be droopy. Fixing delay for on axis and then adjusting y dimensions to place listener below driver axis in software is doubling down on off-axis error.
I think my main problem is understanding how and when to allow for driver timing - when I'm measuring or when in working with the crossover design i.e. in VituixCAD.
Member
Joined 2003
Enter delay value to the driver tab, no need to make any adjustment beyond that. Enter just for the tweeter to avoid over-complicating things.OK.
At 1000mm, difference between drivers is 35mm (tweeter further away).
At 2400mm, difference between drivers is 15mm (tweeter further away).
If I was going to do all the measurements again (on each driver's axis), I would make the adjustments in REW.
But if I don't re-measure, and make the adjustments in VituixCAD, then do I set the woofer driver delay to 0, and the tweeter (further away) to -(35-15) = -20mm, i.e. -58us?
If re-measuring correctly, there is nothing to adjust.
- Home
- Design & Build
- Software Tools
- VituixCAD For Newbies