Hi Popilin,
now I'm certainly not an expert, but I can't see in your sims the ubiquitous ".options plotwinsize=0" directive
Hi Mosquito
I'm lazy to write, so remove compression by hand every time I open the program.

I would suggest as well, to change to ".tran 0 100m 60m 1u" and run FFT using Hann windowing.
Maybe you can get better approximation to real life measurements this way..?
In most cases 20ms is enough, and 1us is too much, so for better definition I use 100ns, needs more time however, much with my old Pentium.
What is Hann windowing?
Hi Kevin
Good to see you around here !
I only have an old scope and a 555 based square wave generator, LTSpice is my only blind cane.
I compared the results from Morgan Jones Valve Amplifiers fourth edition, p.201, 202, and with Koren model 2nd is about -52 dB, close to experimental result, -51dB, for a 6SN7.
Same simulation with Nakabayashi model yields about -41 dB.
BTW, the D3A (triode connected) model is one of yours, and does work fine.
Glad the model works ok.. It seems to be just about right based on measurements in circuit where it matches up pretty well.
Keep an eye on eBay for occasional test equipment bargains. I recently scored a perfectly functional Amber 5500 for about 1/4 of the typical asking price. It's a nice bit of kit. Lots of stuff from Leader and HP for very reasonable prices. A sound card based set up is generally not too expensive, and the Quantasylum QA400 offers nice USB based audio measurement capability for $200 including software. It is a good starting place if not quite perfect based on what I have read.. Here: QA400 Audio Analyzer
Hann windowing is mathematical process for removing extraneous artifacts caused during digital sampling...ie: a tapering of the digital "sampling window," so to speak, at it's beginning and at it's ending.
OK, thanks.
I read over there: Do not use a window if your signal is an integer number of cycles of a periodic signal.
Glad the model works ok.. It seems to be just about right based on measurements in circuit where it matches up pretty well.
Keep an eye on eBay for occasional test equipment bargains. I recently scored a perfectly functional Amber 5500 for about 1/4 of the typical asking price. It's a nice bit of kit. Lots of stuff from Leader and HP for very reasonable prices. A sound card based set up is generally not too expensive, and the Quantasylum QA400 offers nice USB based audio measurement capability for $200 including software. It is a good starting place if not quite perfect based on what I have read.. Here: QA400 Audio Analyzer
Thank you very much, I'll get it.
For now, in my country is very difficult to make foreign purchases.
But I don't want to talk about politics.
This provides general info an FFT and DFT "windowing" process: Window function - Wikipedia, the free encyclopedia
The Nakabayashi numbers do seem high for this circuit -51dB to -60dB would seem about right based on bench experience with a very similar circuit.
I'm stumped
Hopefully we will get to the cause for this discrepancy soon...This provides general info an FFT and DFT "windowing" process: Window function - Wikipedia, the free encyclopedia
Seems that simple windowing function is like Dirac δ function, but widest.
I'm stumped
The funny thing is that more accurate mathematical models, yield less accurate results.
Surely we are missing something.
The funny thing is that more accurate mathematical models, yield less accurate results.
Surely we are missing something.
I think so... please make sure that both circuits have the same Ia and output level, i.e., 8mA and 19.5Vrms. When I did that, the results were nearly the same for 2HD.
Last edited:
I think so... please make sure that both circuits have the same Ia and output level, i.e., 8mA and 19.5Vrms. When I did that, the results were nearly the same for 2HD.
No, both simulations was done in the same conditions, 19.5 VRMS, and about 8 mA .
Eureka-The electron cloud
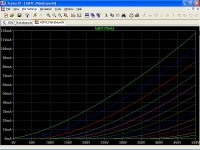
An increase in plate voltage correspond to an increase in plate current, following a 3/2 power law.
An increase in plate voltage make decrease the electron cloud (space charge), and the 3/2 power law tends to a straight line.
Ever I made this comment, and for some reason was not well received.
Conclusion was that the electron cloud afects valve linearity.
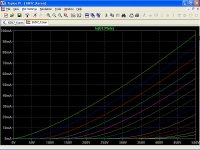
Comparing the curves of two models closely , Nakabayashi models has greater curvature in plate characteristics.
This is "as if" Nakabayashi models represent valves with higher electron cloud, from there the difference in linearity.
An increase in plate voltage correspond to an increase in plate current, following a 3/2 power law.
An increase in plate voltage make decrease the electron cloud (space charge), and the 3/2 power law tends to a straight line.
Ever I made this comment, and for some reason was not well received.
Conclusion was that the electron cloud afects valve linearity.
Comparing the curves of two models closely , Nakabayashi models has greater curvature in plate characteristics.
This is "as if" Nakabayashi models represent valves with higher electron cloud, from there the difference in linearity.
Attachments
Puzzled still... Below is a comparison of the two models vs. the Sylvania datasheet, clearly, the Ayumi model matches up very well with the datasheet, but the Koren model nowhere close... So how can it work better in the mu-follower example? Unless it was based not on the datasheet but rather tweaked based on some actual tubes' traces?...
An externally hosted image should be here but it was not working when we last tested it.
That's not the point, Nakabayashi models fit better than others, the issue is the curvature, look at curves posted by you, Nakabayashi curves have more curvature than the datasheet curves and more curvature than Koren models.
The difference is subtle, but enough to give more than 10 dB distortion.
Edit: Koren model curves don't look so bad as you posted...
Attachments
Last edited:
Vacuum tubes were (back when they had QC) only 20% tolerance devices.
Those data sheet curves were based upon the characteristics of a "bogey" tube, a mathematical, theoretically existing (although some actually exist as "calibration" tubes) tube, where ALL the data was derived from 'averaged' characteristics, not from any single physical tube.
The ONLY way you MIGHT get a tube to replicate the published curves (and then only "close") was if you could find one of the *calibration* tubes--which manufacturers had to "hand pick" from literally thousands of test sample tubes--that were used to calibrate the Tube Tester devices often found in TV repair shops or local drug stores selling replacement radio-TV tubes. Such tubes are VERY hard to find and equally VERY expensive when/if you do find one.
Last edited:
Very instructive, thanks !
Unfortunately, when designing something, all we have available are datasheets, unless you have adequate instruments.
I don't, so my only blind stick are simulations, so accurate models are needed, unfortunately based on the same datasheets.
The purpose of my analysis is to determine why more accurate models yield less accurate results.
I have experienced the same effects of electron cloud measuring Planck's constant with a vacuum photodiode, and I strongly believe that the explanation of post #149 is correct.
Last edited:
That's not the point, Nakabayashi models fit better than others, the issue is the curvature, look at curves posted by you, Nakabayashi curves have more curvature than the datasheet curves and more curvature than Koren models.
The difference is subtle, but enough to give more than 10 dB distortion.
Edit: Koren model curves don't look so bad as you posted...
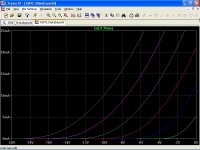
Making slight headway, the Koren model I used came from Intact Audio, that's why the curves were different from yours:
Code:
.SUBCKT 6SN7GTB A G K
XV1 A G K TRIODENH
+PARAMS: LIP= 1 LIF= 0.0037 RAF= 0.02 RAS= 2 CDO= 0
+ RAP= 0.002 ERP= 1.4
+ MU0= 19.2642 MUR= 0.006167 EMC= 0.0000189
+ GCO= 0 GCF= 0.000213
+ CGA=3.90E-12 CGK=2.40E-12 CAK=7.00E-13
.ENDS
I don't have the answer for the discrepancy on THD yet, but to your point on the curvature of the curves - while the curvature of the Ip-Ep curves do have an effect on the linearity of the tube, it is not as important as the curvature of the Ip-Eg curves, or another way of saying it is the spacing between the grid curves on the Ip-Ep characteristic that makes the difference on linearity. Here again, the Ayumi's model does quite well as shown below:
An externally hosted image should be here but it was not working when we last tested it.
So why can't each one of us have a relatively inexpensive tube curve tester that can display 'our own' tube characteristics ? Several guys have been trying them out. Isn't it possible to make one with restricted supplies and capabilities that can be useful for the tubes one has and display it on our monitors.
Anyone?
Anyone?
+1.
Grid-to-plate control (mutual conductance) is the INPUT side of these graphic visual equations/curves.
The grid voltage determines the plate current (via gm), which then translates across to the OUTPUT side of these graphic visual equations/curves (rp and mu) as the Eb-Ib curves.
Steve Bench designed a 'personal' tube testor (the RAT) years ago, it's schematic is still available:
• http://diyaudioprojects.com/mirror/members.aol.com/sbench101/#TubeTest
• http://triodeel.com/tester.htm
Last edited:
Making slight headway, the Koren model I used came from Intact Audio, that's why the curves were different from yours:
I don't have the answer for the discrepancy on THD yet, but to your point on the curvature of the curves - while the curvature of the Ip-Ep curves do have an effect on the linearity of the tube, it is not as important as the curvature of the Ip-Eg curves, or another way of saying it is the spacing between the grid curves on the Ip-Ep characteristic that makes the difference on linearity. Here again, the Ayumi's model does quite well as shown below:Code:.SUBCKT 6SN7GTB A G K XV1 A G K TRIODENH +PARAMS: LIP= 1 LIF= 0.0037 RAF= 0.02 RAS= 2 CDO= 0 + RAP= 0.002 ERP= 1.4 + MU0= 19.2642 MUR= 0.006167 EMC= 0.0000189 + GCO= 0 GCF= 0.000213 + CGA=3.90E-12 CGK=2.40E-12 CAK=7.00E-13 .ENDS
An externally hosted image should be here but it was not working when we last tested it.
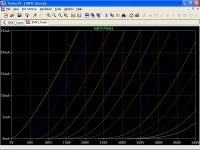
Your Koren model is wrong, original Koren model is on post #151.
Ip-Eg curves can be derived from Ip-Ep curves, and follow the "same" 3/2 power law, so curvature meaning is the same.
Compare for yourself.
Attachments
Last edited:
I don't find any difference with this FFT analysis -- the amplifier is basically SY's "Impasse" using the optimized Koren model, and the Ayumi model:
An externally hosted image should be here but it was not working when we last tested it.
I don't find any difference with this FFT analysis -- the amplifier is basically SY's "Impasse" using the optimized Koren model, and the Ayumi model:
An externally hosted image should be here but it was not working when we last tested it.
Can you post the "Optimized" Koren model, pleasse ?
- Home
- Amplifiers
- Tubes / Valves
- Vacuum Tube SPICE Models