Philips 18040 Model
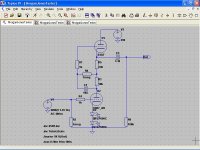
I used 18046's triode data and fudged it to fit 18040's curves, and the SPICE model is shown below, please test it. 18040's datasheet indicates that the maximum Vg1 is -1.3V, perhaps that's why the 0V and -1V curves were not fully visible.
I used 18046's triode data and fudged it to fit 18040's curves, and the SPICE model is shown below, please test it. 18040's datasheet indicates that the maximum Vg1 is -1.3V, perhaps that's why the 0V and -1V curves were not fully visible.
Code:
*
* Generic pentode model: 18040_AN
* Copyright 2003-2008 by Ayumi Nakabayashi, All rights reserved.
* Version 3.10, Generated on Sun Dec 22 12:36:57 2013
*                Plate
*                | Screen Grid
*                | |  Control Grid
*                | |  |  Cathode
*                | |  |  |
.SUBCKT 18040_AN A G2 G1 K
BGG   GG   0 V=V(G1,K)+-0.083801857
BM1   M1   0 V=(0.0081798859*(LIMIT(V(G2,K),0,1e16)+1e-10))**-0.49067171
BM2   M2   0 V=(0.7535145*(LIMIT(V(GG)+LIMIT(V(G2,K),0,1e16)/30.133122,0,1e16)))**1.9906717
BP    P    0 V=0.0067112265*(LIMIT(V(GG)+LIMIT(V(G2,K),0,1e16)/39.990102,0,1e16))**1.5
BIK   IK   0 V=IF(V(GG)>0,1,0)*V(P)+(1-IF(V(GG)>0,1,0))*0.003878634*V(M1)*V(M2)
BIG   IG   0 V=0.0033556133*LIMIT(V(G1,K),0,1e16)**1.5*(LIMIT(V(G1,K),0,1e16)/(LIMIT(V(A,K),0,1e16)+LIMIT(V(G1,K),0,1e16))*1.2+0.4)
BIK2  IK2  0 V=V(IK,IG)*(1-0.4*(EXP(-LIMIT(V(A,K),0,1e16)/LIMIT(V(G2,K),0,1e16)*15)-EXP(-15)))
BIG2T IG2T 0 V=V(IK2)*(0.78812548*(1-LIMIT(V(A,K),0,1e16)/(LIMIT(V(A,K),0,1e16)+10))**1.5+0.21187452)
BIK3  IK3  0 V=V(IK2)*(LIMIT(V(A,K),0,1e16)+15630)/(LIMIT(V(G2,K),0,1e16)+15630)
BIK4  IK4  0 V=V(IK3)-LIMIT(V(IK3)-(0.0036089138*(LIMIT(V(A,K),0,1e16)+LIMIT(V(G2,K),0,1e16)-LIMIT(V(A,K),0,1e16))**1.5),0,1e16)
BIP   IP   0 V=LIMIT(V(IK4,IG2T)-LIMIT(V(IK4,IG2T)-(0.0036089138*LIMIT(V(A,K),0,1e16)**1.5),0,1e16),0,1e16)
BIAK  A    K I=V(IP)+1e-10*V(A,K)
BIG2  G2   K I=LIMIT(V(IK4,IP),0,1e16)
BIGK  G1   K I=V(IG)
* CAPS
CGA   G1  A  0.02p
CGK   G1  K  9p
C12   G1  G2 6p
CAK   A   K  7.5p
.ENDSWhen I had all the answers, they changed me the questions... 
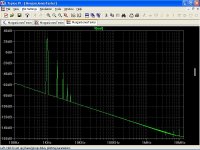
Ayumi Nakabayashi models are very accurate, I could check through the average plate characteristic curves, and average transfer caracteristics curves.
However, in simulations, distortion is 10 dB greater than with Norman Koren models.
To remove doubt, I simulated the circuit proposed by Morgan Jones, again with Norman Koren models the results are consistent (+ - 1 dB) while with Ayumi Nakabayashi models, distortion is always about 10 dB higher.
The million dollar question is: if the valves are defined by their curves, why with more precise curves less accurate results are obtained?
<snip>
The million dollar question is: if the valves are defined by their curves, why with more precise curves less accurate results are obtained?
Did you actually measure any of the tubes in the circuit you based the simulations on?
I typically measure at least 10dB more distortion in an actual circuit than in a simulation using the Koren models. (My latest phono stage design shows this clearly) Could it be that the Ayumi models are getting closer to the truth?
The tools I use to generate models are all based on the Koren equations. (paint_kip, paint_kit, and the uTracer alternate gui) Eventually I will learn the Ayumi method and see how that works.
Hi Kevin
Good to see you around here !
I only have an old scope and a 555 based square wave generator, LTSpice is my only blind cane.
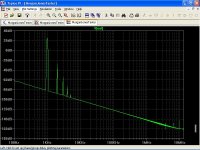
I compared the results from Morgan Jones Valve Amplifiers fourth edition, p.201, 202, and with Koren model 2nd is about -52 dB, close to experimental result, -51dB, for a 6SN7.
Same simulation with Nakabayashi model yields about -41 dB.
BTW, the D3A (triode connected) model is one of yours, and does work fine.
Could it be that the Nakabayashi examples use multiple instances of ABM?
Sorry Jack, I don't know what are you talking about, I merely can run LTSpice...
If you can explain better to a newbie...
Thanks
Does anyone have actual measurement data on the above circuit that we can use as a benchmark? Unfortunately, I don't have the D3A, otherwise, I would breadboard the circuit and test it.
I compared the results from Morgan Jones Valve Amplifiers fourth edition, p.201, 202, and with Koren model 2nd is about -52 dB, close to experimental result, -51dB, for a 6SN7.
Same simulation with Nakabayashi model yields about -41 dB.
One trick is to set up the tubes with different models as a differential amplifiers and look at the output.
I don't think so, 2nd harmonics cancellation.
Edit: maybe, but you must analise 2nd harmonic cancellation, too much for me.
Last edited:
Hi Popilin,
now I'm certainly not an expert, but I can't see in your sims the ubiquitous ".options plotwinsize=0" directive
I would suggest as well, to change to ".tran 0 100m 60m 1u" and run FFT using Hann windowing.
Maybe you can get better approximation to real life measurements this way..?
now I'm certainly not an expert, but I can't see in your sims the ubiquitous ".options plotwinsize=0" directive
I would suggest as well, to change to ".tran 0 100m 60m 1u" and run FFT using Hann windowing.
Maybe you can get better approximation to real life measurements this way..?
- Home
- Amplifiers
- Tubes / Valves
- Vacuum Tube SPICE Models