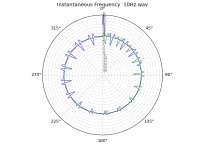
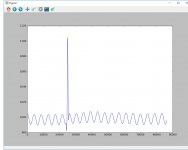
I just thought I might be interesting to see what the resonance test does to our tiny 1kHz and it indeed is...
Attachments
Last edited:
Checking my motor pulley, there is belt residue in places. Any suggestions how to clean this off? The diameter is too small to risk anything abrasive on the aluminium
Q-tip dipped in concentrated isopropyl alcohol, hold it against spinning pulley. Avoid "rubbing alcohol" which contains glycerin as a lubricant, last thing you want on the pulley. You can get >90% isopropyl at any drugstore.
When I worked in a service department we used some other solvent which contained toluene and trichloroethylene, probably illegal now. Acetone probably works well too.
Thanks Gentlemen. This has been very informative thread. I like analysis of plots by everyone. Specially by LD. Lenco plots are posted. And from my limited understanding looks good. What about other classic turntables ? Garrads, Thorens. Does anyone have them ?
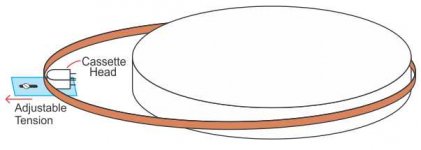
Since Offcenter record is inevitable. How about a simple jig of a cassette tape with frequency tone recorded on it and running around platter (Tapered or strobed platter will not work) and at other end a cassette tape head to give the output of that tone. Absolutely no moving parts to affect speed. The joint of tape can be erased which can be used for one revolution marking. This can only give speed stability measurement so can be combined with test record measurements. And probably both measurements simultaneously taken can provide more analysis ??
Since Offcenter record is inevitable. How about a simple jig of a cassette tape with frequency tone recorded on it and running around platter (Tapered or strobed platter will not work) and at other end a cassette tape head to give the output of that tone. Absolutely no moving parts to affect speed. The joint of tape can be erased which can be used for one revolution marking. This can only give speed stability measurement so can be combined with test record measurements. And probably both measurements simultaneously taken can provide more analysis ??
Attachments
Q-tip dipped in concentrated isopropyl alcohol, hold it against spinning pulley. Avoid "rubbing alcohol" which contains glycerin as a lubricant, last thing you want on the pulley. You can get >90% isopropyl at any drugstore.
I agree with nezbleu suggestion regarding Isopropyl Alcohol, I use it to clean all of the Lenco's drive train. Not sure of its availability at chemist shops (drugstore) this side of the pond but RS or Farnell for example can supply it.
This would not give a tick at each revolution. Perhaps better to apply a tiny line with a permanent marker felt pen and read by an optical sensor.How about a simple jig of a cassette tape with frequency tone recorded on it and running around platter (Tapered or strobed platter will not work) and at other end a cassette tape head to give the output of that tone.
Thanks Gentlemen. This has been very informative thread. I like analysis of plots by everyone. Specially by LD. Lenco plots are posted. And from my limited understanding looks good. What about other classic turntables ? Garrads, Thorens. Does anyone have them ?
Since Offcenter record is inevitable. How about a simple jig of a cassette tape with frequency tone recorded on it and running around platter (Tapered or strobed platter will not work) and at other end a cassette tape head to give the output of that tone. Absolutely no moving parts to affect speed. The joint of tape can be erased which can be used for one revolution marking. This can only give speed stability measurement so can be combined with test record measurements. And probably both measurements simultaneously taken can provide more analysis ??
For total accuracy the platter circumference would need to be concentric with the bearing to quite a high tolerance.. if not we are back to our original issue i.e. off centre test records.
Thanks Gentlemen. This has been very informative thread. I like analysis of plots by everyone. Specially by LD. Lenco plots are posted. And from my limited understanding looks good. What about other classic turntables ? Garrads, Thorens. Does anyone have them ?
Since Offcenter record is inevitable. How about a simple jig of a cassette tape with frequency tone recorded on it and running around platter (Tapered or strobed platter will not work) and at other end a cassette tape head to give the output of that tone. Absolutely no moving parts to affect speed. The joint of tape can be erased which can be used for one revolution marking. This can only give speed stability measurement so can be combined with test record measurements. And probably both measurements simultaneously taken can provide more analysis ??
I seem to recall that the cassette tape medium had wow/flutter issues too, so IMO not likely to be a more stable reference source than a vinyl test disc. Also, the additional tape loop could put a varying drag load on the TT drive motor thereby affecting the very thing we are trying to measure - kind of a Heisenberg uncertainty catch 22.
Ray K
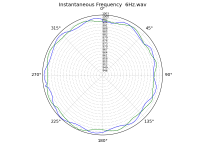
I just thought I might be interesting to see what the resonance test does to our tiny 1kHz and it indeed is...
You're simply adding a low frequency tone to the 1kHz at a higher level which blinds the algorithm, the Hilbert transform does not do it's thing on data like this without some user intervention. The Hilbert transform works a little like FM radio (forget what it's called) but lowering the level of the, say 14Hz, below a threshold the algorithm locks in totally rejecting the low frequency "noise".
Last edited:
You're simply adding a low frequency tone to the 1kHz at a higher level which blinds the algorithm, the Hilbert transform does not do it's thing on data like this without some user intervention. The Hilbert transform works a little like FM radio (forget what it's called) but lowering the level of the, say 14Hz, below a threshold the algorithm locks in totally rejecting the low frequency "noise".
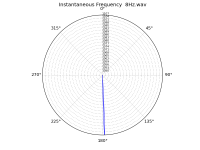
I thought when looking at the script that anything under 60Hz is sharply snipped of, but obviously i misinterpreted it. Esle the 10 and 12 Hz plots wouldn't be possible.
And there is more going on if you listen to the files, its not so that the 1khz and respecting subsonic waves live peacefully along in those examples. And that is the interesting part: inasmuch does subsonic noise affekt or modulate our 1khz signal in a given turntable-arm-cart combo? True, some examples don't compute, but one does (6Hz).
Hmm my Roksan needs more TLC. I have a vibration on the drive belt. The hunt for IPA is on for me as my old stash has evaporated. I'll see where does it locally.
I know how it feels
")
I wish I had this stuff handy when i played around with and try to revive (=make it compete with my other stuff) a Garrard 401 a few years ago.
Hmm my Roksan needs more TLC. I have a vibration on the drive belt. The hunt for IPA is on for me as my old stash has evaporated. I'll see where does it locally.
Isopropyl Alcohol - IPA | CPC UK
I thought when looking at the script that anything under 60Hz is sharply snipped of, but obviously i misinterpreted it. Esle the 10 and 12 Hz plots wouldn't be possible.
but one does (6Hz).
I remembered the term, "capture ratio". If you present two carriers to an FM detector within its bandwidth it does know which one you want to demodulate but a good one will pick the stronger of the two. Your sound card simply rolled off the 6Hz signal until it no longer interfered (or for another reason there is very little in the .wav file). You also misunderstood the filtering it is on the demodulated 1kHz signal after processing.
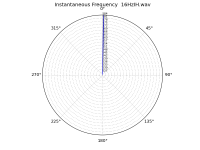
Let me guess these tracks are a combination of a very low frequency tone near typical tonearm cart resonance added to a 1KHz tone to check for residual FM? In that case after the fact the low frequency tone contains no information and pre-filtering it out will give you what you want. I took your 14Hz file and reduced the 14Hz region by 20dB I got this plot, totally removing the 14Hz tone gave the same answer.
It's hard to make a tool that knows how to deal with every unusual input that can be thrown at it. It's easy to add a prefiltering option for data files with large components at frequencies not of interest.
Attachments
Last edited:
Is "quieting" or "full quieting" the buzzword you're looking for, or do you mean something else by "The Hilbert transform works a little like FM radio?"You're simply adding a low frequency tone to the 1kHz at a higher level which blinds the algorithm, the Hilbert transform does not do it's thing on data like this without some user intervention. The Hilbert transform works a little like FM radio (forget what it's called) but lowering the level of the, say 14Hz, below a threshold the algorithm locks in totally rejecting the low frequency "noise".
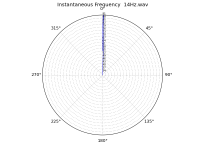
That what I was trying to say: the test LPs groove contains a 1kHz sine and in this case 14 Hz sine to check if your respective arm-cart resonance modulates the signal (or throws the needle out of the groove, with some combos). Here the res-f is at some reasonable 10Hz. In a linear system the corresponding mixture of high and low-F should sound stable, which is not the case near the res.-f.Let me guess these tracks are a combination of a very low frequency tone near typical tonearm cart resonance added to a 1KHz tone to check for residual FM? In that case after the fact the low frequency tone contains no information and pre-filtering it out will give you what you want. I took your 14Hz file and reduced the 14Hz region by 20dB I got this plot, totally removing the 14Hz tone gave the same. .
I simply wanted to know how that plots.
How is it done in the script to remove a frequency?
Edit: its probably easy to prefilter with sox, i think
Last edited:
Is "quieting" or "full quieting" the buzzword you're looking for, or do you mean something else by "The Hilbert transform works a little like FM radio?"
I'm probably mixing the two concepts here. As the above plot shows the process ignores the 14Hz carrier as soon as it is below a certain level relative to the 1k signal. The rejection ratio after a few dB is very large. What is not shown in onvinyl's plots is that all the plots above 10Hz or so are actually trying to show the FM of the low frequency signal but my script was never intended to do that and the post filtering is giving the garbage plots. With a 20Hz pre-filter all his datasets yield the desired information.
Edit: its probably easy to prefilter with sox, i think
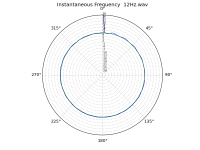
There's more going on. Even prefilterd files do not compute
Code:
sox 12Hz.wav 12-100.wav highpass 100There's more going on. Even prefilterd files do not computeCode:sox 12Hz.wav 12-100.wav highpass 100
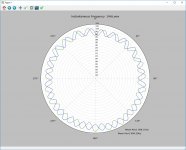
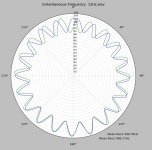
There's still a problem at times with very large ticks or pops where the instantaneous frequency gets a large transient. You can see that in the plot below of the raw data the glitch that goes to 1100Hz pushes the rest of the data down into the origin due to the way the polar plot is scaled. I ran the file through a tick and pop removing plugin after filtering and it is back to what we want. I will work on a way to identify and fix these outliers, most files seem to work pretty well.
Attachments
- Status
- This old topic is closed. If you want to reopen this topic, contact a moderator using the "Report Post" button.
- Home
- Source & Line
- Analogue Source
- Turntable speed stabilty