I accidentally found out that my tube equipment seems to act as a "dynamic expander" according to Dynamic Range (DR) measurement. I noted that Audacity's "Peak" bars were jumping higher when I recorded my tube equipment and I cheked the DR with Foobar2000. The DR was really bigger with tubes! This happens also with just the soundcard loopback (DR is slightly bigger than the original file) but at lesser extent and I don't know if transitor electronics would accumulate the effect like tubes seem to do.
Software: Audacity was used for recording, Foobar2000 played the file with wasapi drivers.
Soundcard: Behringer UMC202HD, acts as the recorder AD-converter in all recdordings. Also acts as DA-converter in measurements 2. and 3.
USB-bridge: (when using tube DAC): Sinxer SU-1
Tube DAC: CS8414 + AD1865 --> I/V-transformer --> simplistic 101D tube stage --> output transformer
Tube pre: TVC transformer --> simplistic 101D tube stage --> output transformer
Tube Amp: simplistic 101D tube stage --> 1:2 interstage transformer --> 300B (or GU50) tube --> output transformer.
When measuring the whole systeem I recorded the signal from speaker output while speaker was connected as a load.
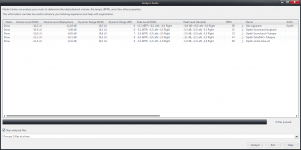
Let the number do the talking.
Left / Right
1. Original file: 6,00dB / 5,80dB = DR 6
2. Soundcard loopback: 6.48 dB / 6.25 dB = DR 6
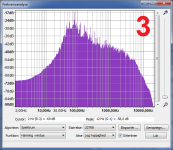
3. Soundcard with the tube pre in the loop: 7.09 dB / 6.69 dB = DR 7
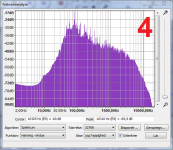
4. Tube DAC + tube pre: 7.91 dB / 7.58 dB = DR 8
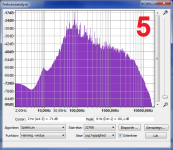
5. Whole system (dac, pre, amp): 8.75 dB / 8.32 dB = DR 9
You can download the files here: Opeth
I hope the magnificent Opeth does not mind being the test signal which I used in my experiment and distribute them for the science.")
The difference was/is so big that it got me very curious what causes the "dynamic expansion". Any speculations?
Software: Audacity was used for recording, Foobar2000 played the file with wasapi drivers.
Soundcard: Behringer UMC202HD, acts as the recorder AD-converter in all recdordings. Also acts as DA-converter in measurements 2. and 3.
USB-bridge: (when using tube DAC): Sinxer SU-1
Tube DAC: CS8414 + AD1865 --> I/V-transformer --> simplistic 101D tube stage --> output transformer
Tube pre: TVC transformer --> simplistic 101D tube stage --> output transformer
Tube Amp: simplistic 101D tube stage --> 1:2 interstage transformer --> 300B (or GU50) tube --> output transformer.
When measuring the whole systeem I recorded the signal from speaker output while speaker was connected as a load.
Let the number do the talking.
Left / Right
1. Original file: 6,00dB / 5,80dB = DR 6
2. Soundcard loopback: 6.48 dB / 6.25 dB = DR 6
3. Soundcard with the tube pre in the loop: 7.09 dB / 6.69 dB = DR 7
4. Tube DAC + tube pre: 7.91 dB / 7.58 dB = DR 8
5. Whole system (dac, pre, amp): 8.75 dB / 8.32 dB = DR 9
You can download the files here: Opeth
I hope the magnificent Opeth does not mind being the test signal which I used in my experiment and distribute them for the science.
The difference was/is so big that it got me very curious what causes the "dynamic expansion". Any speculations?
Last edited:
because the i/v and first stage (tube) has a high slew rate.
Due to the effects of hard limiting, the signal's RMS value is higher than 70.7% when it is mastered for digital. There is about a 3db window before clipping the stage after the DAC and during mastering for digital, This is kept in mind so that the loudness ends up greater than a recording that is recorded that has headroom. Generally the digital masters have about 1% headroom with the peak wave limited (and slightly chopped ) at 10%. This signal is only good for digital as this waveform loses vert/horiz tracking on a 670 processor that is commonly used in cutting record proofs and it becomes low in volume, and distorted.
You are very near the optimal tube DAC circuit. if the I/v stage used the first buffer's grid-cathode circuit. it would have better slew restoration performance (about 8db). Which that is what is lacking in semiconductor based i/v and output stages (about 3db).
The tube DAC known as the DA8-V from JCF is a DAC with a 12ax7 DAC buffer with a 12AU7 out driving a cinemag transformer. These DACs are used in specialized mixing applications where some of the tracks need to be "delimited" so they can be mixed with tracks that are not limited yet.
Interesting : )
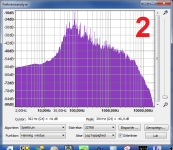
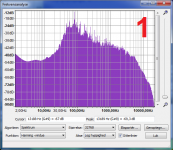
Here is JRivers take on volume-level and DR plus spectrum analyze from Audacity, it looks if one downloads and opens the five spectrums upon each other and thereafter toggle between them that material is lost at LF plus HF stop bands from stage to stage which in my simple thinking is the key DR impove. Especially from point 3 to 4 its clear to see stop bands at both ends are capped a bit when toggled upon each other and from point 4 to 5 show some non linear distortion inside pass band.
File storage on that mediafire website had some nasty bloatware popups : (
Attachments
Last edited:
Thanks for the possible explanations. Some points:
1) The recording with the least slew rate had the highest DR.
2) The slew rate and bandwidth (which ended up in the recording) was also limited by the input sampling frequency of Audacity, 44,1khz. But in reality I do think the high bandwidth quantization noise might affect the dynamics, but in this case the quantization noise and higher slew rate did not end up on the recording?
3) Just inserting the tube pre in the soundcards loop made the DR higher. Also slightly relevant that sound card does not output stepped square wave.
4) I made 12dB/oct high and low pass filters at 25Hz and 15kHz into the original file. The DR changed only by a very small amount. But bandwidth limiting may/will explain some of the higher DR?
I wonder if the filters of the Audacity are normal IIR filters, which also cause the similar phase shift.
Original: 6,00dB / 5,80dB
Bandpass equalized: 6.13 dB / 5.98 dB
File: File sharing and storage made simple
5) Yes, I do not use any global or local NFB, and it might affect this. I can see how the original dynamics could/would be better preserved but not (yet) why they would get expanded over the original.
Maybe this is indeed a result of multiple mechanisms.
Last edited:
I do not know your equipment.
But look at a "simple" amplifier (tube, or FET or BJT). Run a very small signal and measure the gain. Now run a large signal. As the plate swings negative, gain increases. As the plate swings positive, gain decreases. The average is still, nearly, the same as the small-signal gain. But we often measure speech/music with peak detection. This may report the higher-gain side of the wave more than the lower-gain side. If you run up to several % THD this can account for a part-dB higher peaks. Several stages phased so the peaks align may show more rise.
But look at a "simple" amplifier (tube, or FET or BJT). Run a very small signal and measure the gain. Now run a large signal. As the plate swings negative, gain increases. As the plate swings positive, gain decreases. The average is still, nearly, the same as the small-signal gain. But we often measure speech/music with peak detection. This may report the higher-gain side of the wave more than the lower-gain side. If you run up to several % THD this can account for a part-dB higher peaks. Several stages phased so the peaks align may show more rise.
I also wondered this. With steady state signal the THD is approx 1% in the 5th setup when all the tube equipment are connected, the speaker is driven and the signal is recorded from the speaker terminals. This gives some idea what is the distortion in music's peaks. THD is mostly H2 which is ~1% (-40dB), H3 is ~0,03% (-70dB) and higher harmonics lower.
My signal theory is not the best. Is the average power the same in a) theoretical 0% THD sine and b) the same signal in real-life (distorted), it's signal + it's harmonics?
The peaks I can see in the Audacity jump much higher (compared to the average power), like 2-4dB higher. Distortion can explain some of it?
Last edited:
Here's some powerful visuals. Upper two are the Soundcard Loopback (2.), bottom two are the Full tube system (5.).
The difference looks fffing ridiculous.
The difference looks fffing ridiculous.
An externally hosted image should be here but it was not working when we last tested it.
It's obvious also from above picture that the dynamics get "expanded" in both the pos/neg direction, not asymmetrically like one might think because of the inherent asymmetricality of a SE tube amp.
If pics are not showing try Google Chrome.
If pics are not showing try Google Chrome.
An externally hosted image should be here but it was not working when we last tested it.
Yes. No.sser2 said:One reason could be the lack of negative feedback loops in your tube gear. NFB tends to compress signal
To expand on those answers, what can happen with valve equipment lacking negative feedback is that the gain depends on supply rail voltage. The supply rail voltage can depend on how loud the signal was, if the PSU is weak. Some SET amps are deliberately built with weak PSUs as it is believed that this gives better dynamics. What actually happens is that you get gain pumping, based on the signal envelope, which is a form of distortion but this can artificially expand the dynamic range of the signal. It isn't hi-fi as it isn't true to the original signal but some people like it.
Two ways to kill this distortion:
1. add a decent amount of negative feedback - so the gain depends much less on supply rail voltage
2. use a better PSU - so the rail voltage varies much less
In both cases people who can hear the difference may not like it, prefering the original distorted sound.
This effect may be present to a much smaller extent in a preamp, although I would not expect it to be noticeable there. Poor biasing or poor valve choice could also do it; some valve at some bias points may add expansive (rather than the more common compressive) odd order distortion.
Found the culprit! The dynamics are "increased" because of the phase shift of the bandpass filtering of the tube stages and transformers.
I had done the previous experiments with the original file, which does not have headroom to show the increased peaks when filters were applied! When I did identical filtering to original file (1.), Soundcard-loopback file (2.) and "Whole system" file (5.) the Dynamic Range increased in both the Soundcard and Whole system file but not with the original file.
I added 48dB/oct filters to 50Hz and 10khz to rule out the differences in freq response near the extremes. These are the DR results after the filters (they should all be +/- the same):
Original file:
6.08 dB / 5.93 dB
Soundcard loopback:
11.37 dB / 10.59 dB
Whole system:
11.12 dB / 10.41 dB
Does this mean that DSP-filtering and room correction (with compressed files without headroom) is also flawed? Or is the DSP in Audacity bad??
If I were to put a MiniDSP Nanodigi or some other DSP-box in the middle of the signal path, and I do the the exact same 48dB/oct filters at 50hz and 10khz with it instead, with the original file (1.) being played, do I see the the correct increase in the Dynamic Range or not?
Who cares to measure? I have moved on from DSP's and don't own them anymore.
Here's the pictures before and after the 48dB/oct filters from Audacity. The upper pair in both pictures is the "original file" and bottom pair is the "Whole system". The original file gets compressed by the filters and their phase shift - that's why the DR does not increase when one applies filters to the original file!
Without filters:

With filters:

I had done the previous experiments with the original file, which does not have headroom to show the increased peaks when filters were applied! When I did identical filtering to original file (1.), Soundcard-loopback file (2.) and "Whole system" file (5.) the Dynamic Range increased in both the Soundcard and Whole system file but not with the original file.
I added 48dB/oct filters to 50Hz and 10khz to rule out the differences in freq response near the extremes. These are the DR results after the filters (they should all be +/- the same):
Original file:
6.08 dB / 5.93 dB
Soundcard loopback:
11.37 dB / 10.59 dB
Whole system:
11.12 dB / 10.41 dB
Does this mean that DSP-filtering and room correction (with compressed files without headroom) is also flawed? Or is the DSP in Audacity bad??
If I were to put a MiniDSP Nanodigi or some other DSP-box in the middle of the signal path, and I do the the exact same 48dB/oct filters at 50hz and 10khz with it instead, with the original file (1.) being played, do I see the the correct increase in the Dynamic Range or not?
Who cares to measure?
I have moved on from DSP's and don't own them anymore.Here's the pictures before and after the 48dB/oct filters from Audacity. The upper pair in both pictures is the "original file" and bottom pair is the "Whole system". The original file gets compressed by the filters and their phase shift - that's why the DR does not increase when one applies filters to the original file!
Without filters:
With filters:
Last edited:
Not shure i get this stuff other than the band pass filtering effect.
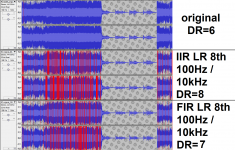
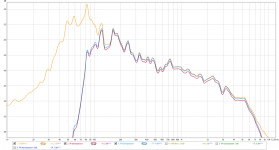
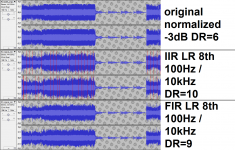
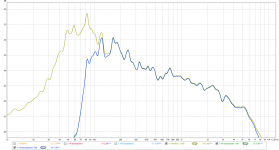
Instead of using Audacity filters tried run original track through JRiver DSP engine with band passed IIR LR 8th order at 100Hz and 10kHz and after that tried same but this time as FIR filter (linear phase). Presented below in Audacity plus DR numbers taken from JRiver, REW plot is spectrum imported from Audacity and smoothed 1/12.
Second set below is same as above except that original track was first normalized -3dB in Audacity before processed.
other than the band pass filtering effect.Instead of using Audacity filters tried run original track through JRiver DSP engine with band passed IIR LR 8th order at 100Hz and 10kHz and after that tried same but this time as FIR filter (linear phase). Presented below in Audacity plus DR numbers taken from JRiver, REW plot is spectrum imported from Audacity and smoothed 1/12.
Second set below is same as above except that original track was first normalized -3dB in Audacity before processed.
Attachments
Does this mean that DSP-filtering and room correction (with compressed files without headroom) is also flawed?
That is already flawed as a concept because it doesn't do anythig to the room. It just distorts the signal to achieve some target results but the reality is that in comparison to a real room correction the orginal signal is diluted.
Marketing figure of speech....
I don't remember the exact explanation.
And you are not alone
All that happens with choke loads is the ability to achieve higher output voltage swings than B+.
The dynamic expansion is entirely subjective.
And you are not alone
All that happens with choke loads is the ability to achieve higher output voltage swings than B+.
The dynamic expansion is entirely subjective.
Thank you for the reminder.
This expansion could happen in any class A output with inductance and a loose enough (but not too high) power supply impedance.
It would manifest itself in transformer coupled inter-stages and choke loaded input stages as long as the power supply is stiff but unregulated.
That could explain in great proportion the craving for s.e.t. sound which naturally has extra bass harmonics with increase dynamics.
Come to think about original track info is also distorted compared to what mastering engineer was listening to when track was finalized because he also sat behind some more stages compared to track info and even if those stages was relative transparent higher specs say in area DC-3-500kHz bandwidth the last stage being acoustic head phones or monitor speakers would add its serious band pass filter.
A linear filter does not affect dynamic range. A distorting filter could affect all sorts of things and render all measurements meaningless.
What do you mean, filter's phase distortion will affect the wave shape and thus the "dynamic range" of the wave form. Below is -1dB and -7dB 1khz square wave with and without 100Hz 48dB/okt HPF. Yes, the filter's "filtering frequency" is much lower than the base frequency of the played square wave and still the phase is distorted.
I figured that square wave is a transient (starts from 0 and accelerates fast) and thus it's very short spectrum (at the exact time when it's state changes from 0 to non-0) is expanded towards high and low frequencies and this is why the phase distortion of the 100Hz filter affects the wave shape of the 1khz square wave. But again my signal theory is shite.
But anyway, filtered and unfiltered square waves have the same "sinusoidal information and level" (if that makes sense), only the phase is distorted and thus the wave shape. The DR of normal square wave is "+2dB", whatever that means
(very low DR and the algorithm gets confused). The DR of the phase distorted square wave is 2dB so there is 4dB difference. For reference the DR of sine wave is 0dB.Also the clipping is clearly visible in the pics what also happened with Opeth, the phase shift "moves the energy" so that the peaks get higher and the left side of the square wave is pronounced.
I wonder how DSP's handle these in general. Thank to BYRTT for measuring the software-DSP of Jriver, which did not handle the test very good(?) without prior digital attenuation. Could somebody else also measure the DR of the Opeth's song after you have put 48dB/oct 50Hz filter in it with the DSP and recorded the signal right after the DAC (which has good bass bandwidth)? Preferably some physical DSP like MiniDSP. Too bad that I don't have Nanodigi anymore, i would measure it myself.
If you want to test it even further, then upsample the Opeth to 24 bits, how the DSP handles it then. DSP's usually force the outputted signal 24 bits so 16bits source material might have better changes of survival?
And the Square Waves....
Without 48dB/oct @ 100Hz HPF
An externally hosted image should be here but it was not working when we last tested it.
With 48dB/oct @ 100Hz HPF
An externally hosted image should be here but it was not working when we last tested it.
Last edited:
- Status
- This old topic is closed. If you want to reopen this topic, contact a moderator using the "Report Post" button.
- Home
- Amplifiers
- Tubes / Valves
- Tube stages and increased measured Dynamic Range (DR) - Explanation?