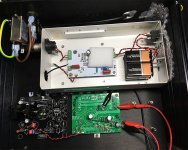
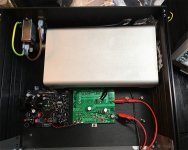
My implementation of Sam Groner's measurement amplifier placed within the enclosure. Coax cable from reg DUT output to the measurement amplifier's input. Then the lid is placed on the enclosure. Not as professional a setup as could be done but I think likely ok for my purposes. Results to follow...
Attachments
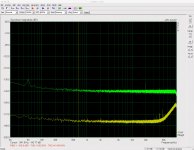
I made measurements using ARTA's spectrum analyser with the following stimuli:
Hz: 100, 500, 1K, 2K, 5K, 10K, 20K, 30K, 40K, 50K, 60K, 70K, 80K, 90K
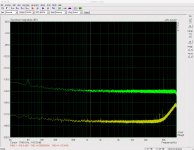
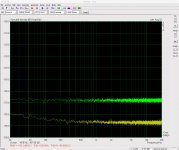
You can see the FFT settings I used in the pics below. Y axis scaling was dBV. The yellow trace is what I got when I shorted the input to the Groner measurement amplifier. I left this is a reference for all the measurements. You can see that despite my shielding efforts I was still picking up a bit of 50Hz interference.
Placing the cursor at exactly the frequency of interest wasn't possible in many instances. Where it was I add a decimal place below. For the rest it is within a few Hz of the FOI.
Results:
100 -136dB
500 -138
1k -139
2k -139
5k -136
10k -136
20k -134
30k -132.5
40k -130
50k -127
60k -127.5
70k -122
80k -122
90k -124.0
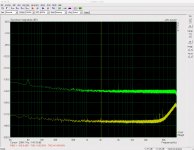
Hz: 100, 500, 1K, 2K, 5K, 10K, 20K, 30K, 40K, 50K, 60K, 70K, 80K, 90K
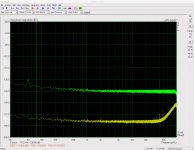
You can see the FFT settings I used in the pics below. Y axis scaling was dBV. The yellow trace is what I got when I shorted the input to the Groner measurement amplifier. I left this is a reference for all the measurements. You can see that despite my shielding efforts I was still picking up a bit of 50Hz interference.
Placing the cursor at exactly the frequency of interest wasn't possible in many instances. Where it was I add a decimal place below. For the rest it is within a few Hz of the FOI.
Results:
100 -136dB
500 -138
1k -139
2k -139
5k -136
10k -136
20k -134
30k -132.5
40k -130
50k -127
60k -127.5
70k -122
80k -122
90k -124.0
Attachments


Indeed and it would appear to perform rather admirably versus those tested by Jack. (I believe the Jung regulator had an LM317 pre-reg in that test.)
Many thanks to you!
FYI I tested 50Hz - it did not resolve above the noise floor at -130dB.
I know you are travelling but if things like the FFT settings (Hanning, 65k) / spectrum scaling (dBV) could/should have been different do let me know. (Also, I used 1/3 octave smoothing.)
Many thanks to you!
FYI I tested 50Hz - it did not resolve above the noise floor at -130dB.
I know you are travelling but if things like the FFT settings (Hanning, 65k) / spectrum scaling (dBV) could/should have been different do let me know. (Also, I used 1/3 octave smoothing.)
I'm confident the measurement amplifier is running correctly with the right gain - while I am inserting its nominal gain of 1000 into ARTA I have tested this by measuring a 1k resistor. The spectral noise density came in around -168dB. Seems good enough for my purposes.
I'm confident of the input stimulus.
I'm just less confident on selecting the right settings in an FFT analysis. If my settings are appropriate I think this is all done.
I'm confident of the input stimulus.
I'm just less confident on selecting the right settings in an FFT analysis. If my settings are appropriate I think this is all done.
Attachments
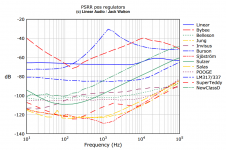
Walton's measurements in #365 show a 20dB/decade degradation of line rejection at frequencies > 10K for all the best ones and many of the ordinary ones. Your data table in #362, does not. Why?
Testing a known-mediocre regulator like 7812 or LM317, which is known to have degraded line rejection at high frequency, might confirm or refute the hypothesis that your measurement machine is "stuck at -120dB" and giving out wrong results.
Testing a known-mediocre regulator like 7812 or LM317, which is known to have degraded line rejection at high frequency, might confirm or refute the hypothesis that your measurement machine is "stuck at -120dB" and giving out wrong results.
Ok I will test a 7812. I have ordered some.
FWIW I checked the output of the rail driver connected to the reg DUT (with its load attached) with my scope. At all test frequencies the scope's Vpp function read 1Vpp. (At 90kHz it was a little high at 1.04/6Vpp.) So the rail driver / ripple stimulus is good under load.
FWIW I checked the output of the rail driver connected to the reg DUT (with its load attached) with my scope. At all test frequencies the scope's Vpp function read 1Vpp. (At 90kHz it was a little high at 1.04/6Vpp.) So the rail driver / ripple stimulus is good under load.
Maybe you are right. LM7812 test results below.
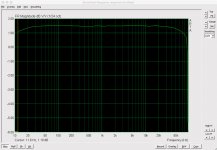
My first thought as to a potential culprit was the frequency response rolloff (filter) of my sound card above 20kHz (see attached) but this is down only about 1.5dBV at 90kHz although the test which produces that chart presumably measures the card output for a prescribed stimulus.
LM7812 test results:
50 Hz -57dBV
100 -59
500 -69
1k -79
2k -82
5k -74
10k -70
20k -64
30k -62
40k -60
50k -59
60k -58
70k -57
80k -57
90k -56
Attachments
Last edited:
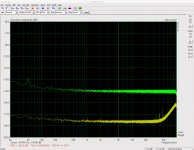
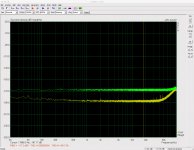
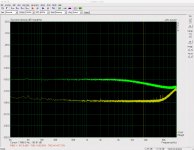
I took another look at measuring the spectral noise density of a 1K resistor again but with the wider frequency range. Yellow is input to measurement amplifier shorted; green shorted with 1k metal film resistor. Note spectrum scaling changed to 'power spectral density' dBV. The noise floor becomes an issue for this test out past 50kHz but surely this is a non-issue for the PSRR tests. Seems 'flat' at around the expected level of noise.
Attachments
As an aside, I am getting myself horribly confused with respect to the relationship between the input stimulus (here we used Vpp=1V, 0.3536Vrms) and the selection of the spectrum scaling - Y axis. Not that things need be so accurate but wouldn't one ideally set an input stimulus that was of the same scale as the spectrum scaling? I selected dBV and 0.35Vrms is -9dBV. Is it the case that 9dB should be added to the ripple rejection ratio measured (assuming it is correctly measured) at any given frequency?
Sorry, can't help. I haven't taught myself to use one of those things yet, but will do so pretty soon. I'm sending a class A amplifier PCB to fab this month, which will need careful testing on all sorts of gear, probably including something like this. Right now though, I know nuffink.
The pre-amplification is done before the sound card. Hence I don't see that there can be any amplification of sound card (bad) performance. The small roll off in frequency response will be just that - less than a couple of dB. Not worth worrying about for these purposes and certainly not a cause of a 20dB per decade rolloff.
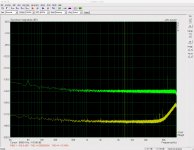
I went back to the design spec of Sam Groner's pre-amplifier. It is certainly meant to be well capable of flat response out to 100kHz. (See article from Linear Audio.) The measurement of a 1k resistor shows a flat noise level out to 60-70kHz, i.e. until the noise of the test setup becomes a factor, at about the right level. I was expecting to see a similar profile for a larger resistor. If I have done my calculations correctly, a 470k resistor should have a flat thermal noise at 21C of about 87nV/rtHz or -141dBV. I'm obviously getting nothing of the sort from the pre-amp. Perhaps my calculations/expectations are wrong.
I have tried to reinvigorate the Sam Groner measurement amplifier thread in the equipment and tools section to see if someone can help.
My question regarding input vs scale is a generic one. But I think the answer to my question is "no". PSRR is relative and the measured results are also in relative terms. Only if one wanted to know the actual voltage level measured would one need to know the input stimulus in V. I think...
(If you haven't looked at it already ARTA can be used fully in demo mode. ARTA Software One just can't export data but then that's not an issue when one can record results with a screen grab. Obviously this sort of testing only uses a fraction of what the whole suite is capable of. Toni Strobl uses an Asus Xonar Essence sound card and ARTA alongside his other equipment - without a preamp he can measure with a noise floor below circa -130dB. He has swapped out the card's op amps for LM4562. Unfortunately I run a Mac which can't take this sound card. I use an ESI Juli@ xTe.)
Last edited:
I decided to test the frequency response of the preamp by coupling up my signal generator to the input and looking at the spectrum analyser in ARTA (set to dBV). As my signal generator can't go below 4mVpp output I used a simple 1kR and 100R voltage divider at the input of the preamp and dialled in 11mVpp at the generator. Unless I am going kooky or have made another basic error it would seem the frequency response of the pre-amp/soundcard/ARTA setup is flat (enough for my purposes).
At all stimulus frequencies the RMS figure in ARTA read between -69.6 and -69.8 dBV. (Only at 500Hz was it 69.6dBV, otherwise mostly 69.7 except for one or two of the higher frequencies.) Cursor readings at the stimulation frequencies were as follows:
100Hz -69.75 dBV
500 -70.25
1k -70.32
2k -70.20
3k -69.98
5k -70.13
10k -70.83
20k -69.80
30k -70.35
40k -70.02
50k -70.02
60k -70.40
70k -69.83
80k -70.92
90k -69.97
I think I am right in doing the following calculation. I had entered a preamp gain of 1000 in ARTA (the nominal value for the preamp circuit). -69.7dBV is 926uV. My generator stimulus was 11mVpp. If my voltage divider were perfect the actual gain of the pre-amp is 926. The resistors in the voltage divider were 2%. My multimeter can measure to 1.2% + 2 digits at 400R and 1% +2 digits at 4k. I measured 1.003k Ohms and 99.4 Ohms respectively. So my pre-amp gain may well be a little over 926x.
So doesn't seem too bad... Not sure I understand the measurement of the 470k resistor...
- Status
- This old topic is closed. If you want to reopen this topic, contact a moderator using the "Report Post" button.
- Home
- Amplifiers
- Power Supplies
- Thermal considerations for Fairchild SDIP bridge rectifiers