.....What can completely flatten it is a impedance flattened circuit. I forget what they are called? Maybe a Zobel but at fs. Byrtt has shown me some pretty nice examples he did on his drivers.....
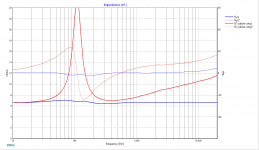
") below a example TC9FD in free air blue show the network in action.
below a example TC9FD in free air blue show the network in action.It seems have many names but technical its a RLC and RC network and suggest if its needed keep an eye on impulse and step response + group delay and if those doesn't get worse but stay the same or improve, then subjective switching in and out it can be a knight and day experience if system has HQ.
Intend over the weekend will show how it affect a 10F8424G00 over xrk971 nice thread http://www.diyaudio.com/forums/full-range/273524-10f-8424-rs225-8-fast-ref-monitor.html.
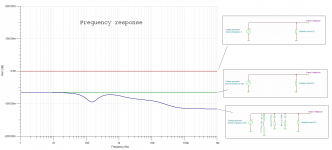
Right now I'm fighting to tame impedance curve for 10F that got worse than in free air when put to a box, its much more sensitive and nervous than a TC9FD, below plot all taken in free air show my 2 brand new 10F tight overlayed and orange is the smoother TC9FD.
Attachments
Hi BYRTT,
What did you notice by adding a RCL network? Does it do anything to/for the sound when using a regular Class A/B amplifier?
I've thought about is but read several reports it wouldn't do much good when using solid state amps etc.
But I'm open for a different view...
What did you notice by adding a RCL network? Does it do anything to/for the sound when using a regular Class A/B amplifier?
I've thought about is but read several reports it wouldn't do much good when using solid state amps etc.
But I'm open for a different view...
Last edited:
Hi BYRTT,
What did you notice by adding a RCL network? Does it do anything to/for the sound when using a regular Class A/B amplifier?
I've thought about is but read several reports it wouldn't do much good when using solid state amps etc.
But I'm open for a different view...
My experience goes for 2426H horns, a 12" guitar speaker but mostly for A10.2 full rangers. Just been busy else stuff and will try it out soon on FAST system tweeters TC9 plus 10F and woofer SPH-250KE and then share objective and subjective data.
What i noticed.
Subjective:
Sounds little as having a objective shorter waterfall plot than before in some frequency areas that is clearer now, and system seems get a step or more to be less track and genre dependent.
Objective:
My amps Sansui AU-D9 runs colder.
Cones are clear visual getting back to point zero in no time without oscillating as a spring around point zero compared lifting the network, this is of course the resonance network (RLC) doing this but same must happen for inductance network (RC) it’s just so fast a frequency the eye can’t see.
Other logics happening:
My amps are NFB ones feeling continuous on speaker output to correct at input, then when the cone motor motion is electric dampened at the box end of speaker cable the current don’t reach back at same level as without network to the power amp and distort amps feedback compensation circuit.
In simulation program for a power amp if putting the real speaker load as load instead of linear resistor and then zooming into uS or nS group delay envelope shows exactly same curve as a DATS plot. Even this is small shoes to take on amp is faster on higher Z frequencies areas than lower Z areas.
If you send me left and right line arrays impedance curve then coming week i could send you two tweaked trial networks that power wise could take full power for shorter time and at normal to middle SPL work without overheating
, then you could share experience and buy some more heavy and precision components if it raise sound performance.
Last edited:
Maybe the better CSD/waterfall data of the 10F compared to TC9 is due to fiberglass cone.
They claim the fiberglass cone deals better with standing waves in the cone.
TG9 also uses same type of cone material. Did anyone compare the waterfall data of the TG9 with 10F? They may be very similar!
The 10F is 5X the price of the TG9!!
They claim the fiberglass cone deals better with standing waves in the cone.
TG9 also uses same type of cone material. Did anyone compare the waterfall data of the TG9 with 10F? They may be very similar!
The 10F is 5X the price of the TG9!!
Maybe the better CSD/waterfall data of the 10F compared to TC9 is due to fiberglass cone.
They claim the fiberglass cone deals better with standing waves in the cone.
TG9 also uses same type of cone material. Did anyone compare the waterfall data of the TG9 with 10F? They may be very similar!
The 10F is 5X the price of the TG9!!
Check out the big Vifa TC9 thread, it's all in there already. The TG9 has a cleaner CSD plot. But not as clean as the 10F if I remember correctly. Also links are provided to the TG9 predecessor, the 10BG. Probably the one the 10F was modelled after. The TG9 seems to be discontinued though.
My experience goes for 2426H horns, a 12" guitar speaker but mostly for A10.2 full rangers. Just been busy else stuff and will try it out soon on FAST system tweeters TC9 plus 10F and woofer SPH-250KE and then share objective and subjective data.
What i noticed.
Subjective:
Sounds little as having a objective shorter waterfall plot than before in some frequency areas that is clearer now, and system seems get a step or more to be less track and genre dependent.
Objective:
My amps Sansui AU-D9 runs colder.
Cones are clear visual getting back to point zero in no time without oscillating as a spring around point zero compared lifting the network, this is of course the resonance network (RLC) doing this but same must happen for inductance network (RC) it’s just so fast a frequency the eye can’t see.
Other logics happening:
My amps are NFB ones feeling continuous on speaker output to correct at input, then when the cone motor motion is electric dampened at the box end of speaker cable the current don’t reach back at same level as without network to the power amp and distort amps feedback compensation circuit.
In simulation program for a power amp if putting the real speaker load as load instead of linear resistor and then zooming into uS or nS group delay envelope shows exactly same curve as a DATS plot. Even this is small shoes to take on amp is faster on higher Z frequencies areas than lower Z areas.
If you send me left and right line arrays impedance curve then coming week i could send you two tweaked trial networks that power wise could take full power for shorter time and at normal to middle SPL work without overheating
Thanks for the write up, I'll get some new impedance curves soon as the ones I have already were taken right after finishing the lines.
I'll try anything, just to learn something
.My experience goes for 2426H horns, a 12" guitar speaker but mostly for A10.2 full rangers...
Subjective:
Sounds little as having a objective shorter waterfall plot than before in some frequency areas that is clearer now, and system seems get a step or more to be less track and genre dependent.
Objective:
My amps Sansui AU-D9 runs colder.
Cones are clear visual getting back to point zero in no time without oscillating as a spring around point zero compared lifting the network,..
Sounds good BYRTT, I may want to try that with my Alpair 12s. It will be a while before I can get an impedance reading, as I do not have my DATS yet...
As far as the TG9, I believe parts-express still has these available:
Tymphany TG9FD-10-04 3-1/2" Glass Fiber Cone Full Range
Not sure what is available in Europe though...
Last edited:
The 10F is 5X the price of the TG9!!
and You would have to cut the bezel down for ideal spacing. Shame to pay that and have to re-engineer it right out of the box!
Sounds good BYRTT, I may want to try that with my Alpair 12s. It will be a while before I can get an impedance reading, as I do not have my DATS yet...
As far as the TG9, I believe parts-express still has these available:
Tymphany TG9FD-10-04 3-1/2" Glass Fiber Cone Full Range
Not sure what is available in Europe though...
The 4 ohm version of the TG9 does not equal the performance of the 8 ohm though.
You want the 8ohm version - still available at Madisound.
https://www.madisoundspeakerstore.c...s-tg9fd10-08-3.5-fiberglass-full-range-8-ohm/
https://www.madisoundspeakerstore.c...s-tg9fd10-08-3.5-fiberglass-full-range-8-ohm/
Thanks for the write up, I'll get some new impedance curves soon as the ones I have already were taken right after finishing the lines.
I'll try anything, just to learn something
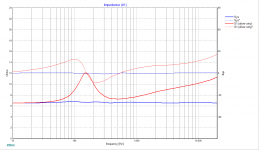
Good thing to measure again because just small change for box change Z-curve and therefor the filter and component values is last thing to add the build to have best final Z-curve precision.
Hope we learn something the exercise and after all you seems right person (critical) to judge such filter in that you have already a beautifully objective data performance speaker and still working on the eyebrows
.Looking forward results and if you find it a improvement that we can document some data for it else than just subjective data.
.....After all I'm still working on the eyebrows...

......
I'll be happy to test it, have read a lot of opinions supporting both camps. One camp says it can't change a thing for solid state amps. Another camp that is convinced it does do something right.
All I know so far from all of my tests is that the difference between good and great is (probably) very small. Yet big in perception. It would be fun to find out more about the ingredients that make up that small difference.
Closing in on those eyebrows.
All I know so far from all of my tests is that the difference between good and great is (probably) very small. Yet big in perception. It would be fun to find out more about the ingredients that make up that small difference.
Closing in on those eyebrows
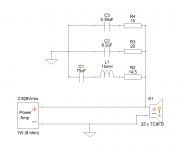
.Impedance networks
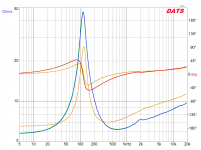
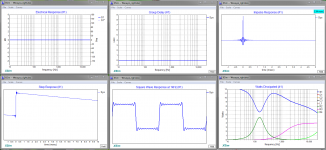
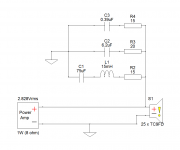
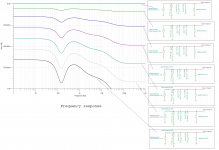
Here the impedance linearization networks for left and right line array and only difference is a small change R2. Used free program XSim to model schematic program available here http://www.diyaudio.com/forums/multi-way/259865-xsim-free-crossover-designer.html.
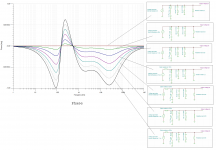
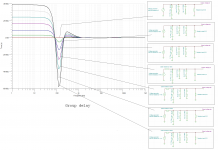
The plots with Electrical response, Group delay, Impulse response, Step response, Square wave response is just to document the network doesn't change anything if i switch network in or out at the X Y scaling build into program. Because those five plots looks so good is because the driver model is wideband from DC-infinite HF and these plots would change alot if i had the measured response as frd file linked to the driver model S1 and then making the system a bandpass instead. The plot Watts dissipated for components is with 10watt feeded.
Interesting is small things is happening if the network is put as load in a program intended building amps and so on, for that used free from Texas Instruments TINA-TI V9. The three plots is frequency response phase and group delay. If a amp have real zero ohm impedance as shown with the voltage generator at 0 filter have no influence but see small things happen when setting amp to 50mOhm.
Will procure components then ship to Netherland and look forward get feedback.
Here the impedance linearization networks for left and right line array and only difference is a small change R2. Used free program XSim to model schematic program available here http://www.diyaudio.com/forums/multi-way/259865-xsim-free-crossover-designer.html.
The plots with Electrical response, Group delay, Impulse response, Step response, Square wave response is just to document the network doesn't change anything if i switch network in or out at the X Y scaling build into program. Because those five plots looks so good is because the driver model is wideband from DC-infinite HF and these plots would change alot if i had the measured response as frd file linked to the driver model S1 and then making the system a bandpass instead. The plot Watts dissipated for components is with 10watt feeded.
Interesting is small things is happening if the network is put as load in a program intended building amps and so on, for that used free from Texas Instruments TINA-TI V9. The three plots is frequency response phase and group delay. If a amp have real zero ohm impedance as shown with the voltage generator at 0 filter have no influence but see small things happen when setting amp to 50mOhm.
Will procure components then ship to Netherland and look forward get feedback.
Attachments

Last edited:
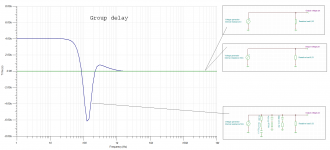
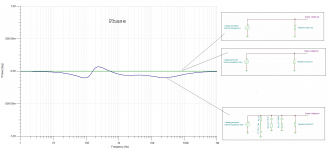
Excellent BYRTT,
I actually recognise the group delay plot, from when I gated (17 ms) the group delay of my left channel (the cleanest plot if you look at early reflections). DRC obviously tries to straighten it out in a larger window but the shape is very familiar.

So I am expecting to see a change here... It also makes it clear to me the right channel suffers due to an early reflection, which was already obvious judging the frequency and impulse response. I'll try and track down what is causing the reflection to get better results there.
Looking forward to testing the results. Seeing this makes me think it can be very beneficial in the early first wave arrival at the listening position.
This stuff is getting me exited!
I actually recognise the group delay plot, from when I gated (17 ms) the group delay of my left channel (the cleanest plot if you look at early reflections). DRC obviously tries to straighten it out in a larger window but the shape is very familiar
.
So I am expecting to see a change here... It also makes it clear to me the right channel suffers due to an early reflection, which was already obvious judging the frequency and impulse response. I'll try and track down what is causing the reflection to get better results there.
Looking forward to testing the results. Seeing this makes me think it can be very beneficial in the early first wave arrival at the listening position.
This stuff is getting me exited!
Just looked up specs of my Amplifier, damping factor is said to be 70, does that help us to calculate its output impedance?
(just noticed this isn't the Mark II, I'll look if I can find better specs)

Better specs:
As found on: Pioneer A-717, a Retrospective - Page 2 - AudioKarma.org Home Audio Stereo Discussion Forums
(just noticed this isn't the Mark II, I'll look if I can find better specs)
Better specs:
Code:
A-757 MKII

 Continuous power output (both channels driven at 20Hz to 20KHz)**
 T.H.D 0.003%, 8Ohm .......................... 95W + 95W*
 T.H.D 0.005%, 4Ohm ....................... 140W + 140W*

 DIN continuous power output (both channels driven)
 1KHz, T.H.D. 1.0%, 8Ohm .................. 100W + 100W
 1KHz, T.H.D. 1.0%, 4Ohm .................. 150W + 150W

 Power bandwidth
 0.05%, 8Ohm .................................. 5Hz to 70KHz*

 Damping factor
 (1KHz/20Hz to 20KHz), 8Ohm ...................... 200/70*

 Dynamic power output (on EIA dynamic test signal)
 4Ohm/2Ohm ........................................ 200W/300W***

 Total harmonic distortion **
 20Hz to 20KHz, 95W, 8Ohm ........................ 0.003%*
 20Hz to 20KHz, 140W, 4Ohm ....................... 0.005%*
 Inter-modulation distortion (at rated output) .. 0.003%*

 Input sensitivity/impedance
 PHONO (MM) ...................................... 2.5mV/50KOhm
 PHONO (MC) ....................................... 0.2mV/100Ohm
 CD, TUNER, LINE, TAPE ......................... 150mV/50KOhm

 PHONO overload level
 1KHz, T.H.D. 0.008% (MM/MC) ................... 200mV/19mV

 Output level/impedance
 TAPE REC, ADAPTOR OUTPUT ................. 150mV/2.2KOhm

 Frequency response
 PHONO (MM) 20Hz to 20KHz .............................. +-0.2dB
 PHONO (MC) 20Hz to 20KHz .............................. +-0.3dB
 CD, TUNER, LINE, TAPE (1Hz to 150KHz) .......... +0dB/-3dB

 Tone control (volume control set at -40dB position)
 BASS .................................................. .........+-8dB (100Hz)
 TREBLE .................................................. ......+-8dB (10KHz)
 Loudness contour (volume control set at -40dB position)
 ........................................ +5dB (100Hz)/+3dB(10KHz)
 Filter (SUBSONIC) ...................................... 17Hz (12dB/oct.)

 Signal-to-Noise ratio (IHF short circuit, A network)
 PHONO (MM, 5mV input/MC 0.5mV input) ................ 98dB/77dB*
 CD, TUNER, LINE, TAPE .............................................. 110dB*
 Signal-to-Noise ratio (DIN, continuous power/50mW)
 PHONO (MM, 5mV input/MC 0.5mV input) ................ 74dB/65dB*
 CD, TUNER, LINE, TAPE ........................................ 92dB/68dB*

 Power Supply/Miscellaneous****
 Power requirements .......................... a.c. 220 Volts ~, 50/60 Hz
 Power consumption .................................................. .... 820 W
 Dimensions ............................ 420 (W) x 435 (D) x x 162 (H) mm
 Weight (without package) ................................. 19.5 kg (43 lbs)

 * Measured with the DIRECT switch set to ON.
 ** Measured by Audio Spectrum Analyzer.
As found on: Pioneer A-717, a Retrospective - Page 2 - AudioKarma.org Home Audio Stereo Discussion Forums
Last edited:
More about impedance networks
Think this gets pretty exiting thanks the data you support in post 1156/1157 because as you say below we probably just look for very small tweaks to go from good to great particular for your system. Others may think we go in too small shoes here but if that network end up being a improvement then at same seems we can document data parameters that change in the system adding the corrections and that's a force that can lead to logic too for us measurement data believers.
Ofcourse i could hope the network will repair all of the group delay resonance shown in post 1156 but fear it seems be too many mSec repair needed there, and a speculation is if this behavour is maybe why many recommend a drivers passband is preferred to be XO higher in frequency than its resonance or it could be the downside of the lines length you have mentioned before, but lets see how much the network change that resonance in real world.
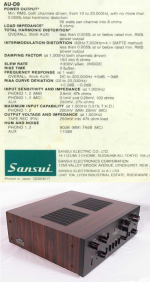
Regarding output impedance your amp wonder is damping factor 70 or 200, gives 114 or 40 mOhm output impedance into 8ohm loads. See attached data my amp funny how close our respective amps are at specs and that i used 50mOhm for the amp sim was influenced by own amp data.
Attach some new amp plots based on 40 and 114mOhm output impedance and with the 114mOhm output impedance one added four steps of speaker cable resistance. Personal i prefer and use cat5 or 6 solid cable for speakers in lengths up to 4 meters. Such cable typical add 100mOhm resistance each meter and I'm surprised looking at the plots how much things change then. This makes me think left and right speaker needs same length cable for precision setups and wonder if right line array have shorter speaker cable in its placed much closer to amp. In i have two physic stereo AU-D9 amps think i will try move one out to each speaker with short 1 meter cable and see what happens to sound. Regarding adding R to sim speakercable i could very well add L and C but lets take that later I'm not pro this stuff so it takes me quite some time. Could even go further and with my DATS device measure both RLC real world for my speaker cables.
Think this gets pretty exiting thanks the data you support in post 1156/1157 because as you say below we probably just look for very small tweaks to go from good to great particular for your system. Others may think we go in too small shoes here but if that network end up being a improvement then at same seems we can document data parameters that change in the system adding the corrections and that's a force that can lead to logic too for us measurement data believers.
.....All I know so far from all of my tests is that the difference between good and great is (probably) very small. Yet big in perception. It would be fun to find out more about the ingredients that make up that small difference.
Closing in on those eyebrows
Ofcourse i could hope the network will repair all of the group delay resonance shown in post 1156 but fear it seems be too many mSec repair needed there, and a speculation is if this behavour is maybe why many recommend a drivers passband is preferred to be XO higher in frequency than its resonance or it could be the downside of the lines length you have mentioned before, but lets see how much the network change that resonance in real world.
Regarding output impedance your amp wonder is damping factor 70 or 200, gives 114 or 40 mOhm output impedance into 8ohm loads. See attached data my amp funny how close our respective amps are at specs and that i used 50mOhm for the amp sim was influenced by own amp data.
Attach some new amp plots based on 40 and 114mOhm output impedance and with the 114mOhm output impedance one added four steps of speaker cable resistance. Personal i prefer and use cat5 or 6 solid cable for speakers in lengths up to 4 meters. Such cable typical add 100mOhm resistance each meter and I'm surprised looking at the plots how much things change then. This makes me think left and right speaker needs same length cable for precision setups and wonder if right line array have shorter speaker cable in its placed much closer to amp. In i have two physic stereo AU-D9 amps think i will try move one out to each speaker with short 1 meter cable and see what happens to sound. Regarding adding R to sim speakercable i could very well add L and C but lets take that later I'm not pro this stuff so it takes me quite some time. Could even go further and with my DATS device measure both RLC real world for my speaker cables.
Attachments
Last edited:
This makes me think left and right speaker needs same length cable for precision setups and wonder if right line array have shorter speaker cable in its placed much closer to amp. In i have two physic stereo AU-D9 amps think i will try move one out to each speaker with short 1 meter cable and see what happens to sound. Regarding adding R to sim speakercable i could very well add L and C but lets take that later I'm not pro this stuff so it takes me quite some time. Could even go further and with my DATS device measure both RLC real world for my speaker cables.
I have the same cable length on both sides. I thought about a shorter line to the right speaker but didn't dare. I've read countless times it shouldn't change much but figured to leave them exactly the same, if only for their internal resistance. Also made sure not to make a nice rolled up bundle there.
It will be fun to see how this works out. We might actually learn a thing or two
.- Home
- Loudspeakers
- Full Range
- The making of: The Two Towers (a 25 driver Full Range line array)