Hi David,
I agree with your statement in Post #1315: "...would be nice to see some actual measured results for two or more identical speakers connected in series...", and I wish I had access to time, speakers and measuring equipment, but at this time I don't.
You already found the major problem, sound power v. sound pressure addition.
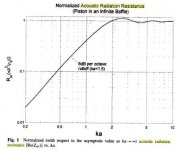
Going back to acoustic radiation resistance, it just has to be taken into account. Obviously, you already take it into account for the single driver case, and thus in the multiple case you should only see a shift of the turn-over point where the curve goes from the low end 6dB slope into the constant value high end, or approximately "ka=2". This effect - the shifting down of the ka=2 point - may be small enough to be hard to extract from a measurement, so it may look like a 6dB shift throughout, with possibly a small boost in the low end.
Regards,
I agree with your statement in Post #1315: "...would be nice to see some actual measured results for two or more identical speakers connected in series...", and I wish I had access to time, speakers and measuring equipment, but at this time I don't.
You already found the major problem, sound power v. sound pressure addition.
Going back to acoustic radiation resistance, it just has to be taken into account. Obviously, you already take it into account for the single driver case, and thus in the multiple case you should only see a shift of the turn-over point where the curve goes from the low end 6dB slope into the constant value high end, or approximately "ka=2". This effect - the shifting down of the ka=2 point - may be small enough to be hard to extract from a measurement, so it may look like a 6dB shift throughout, with possibly a small boost in the low end.
Regards,
Attachments
Last edited:
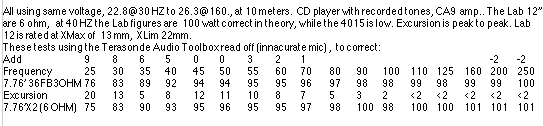
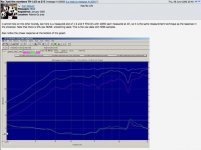
Below are measurements of a dual Lab 12 BR cabinet, then two in series, same voltage done 2/18/08 (prior to my getting Smaart).It would be nice to see some actual measured results for two or more identical speakers connected in series, to establish whether or not the SPL actually does stay the same as that for a single speaker - for a constant voltage input.
Kind regards,
David
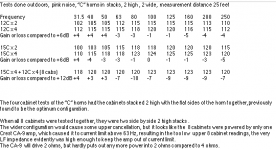
The SPL measurements were averaged up or down to the nearest whole numbers appearing on the dB meter.
The LF are basically the same SPL, the 90 Hz difference of 2 dB may be a clerical error, the 1-2 dB difference above 110 dB probably could be attributed to slight beamwidth narrowing with the larger array.
My stage monitors use a pair of 8” in series, the pair measures the same as a single driver given the same voltage.
For Hornresp purposes, using equal SPL level for 2 speakers in series compared to a single given the same voltage is correct.
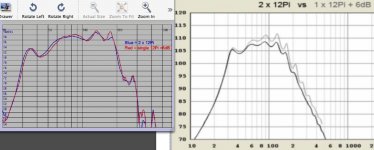
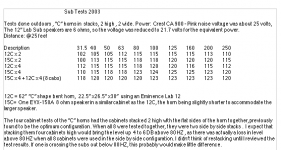
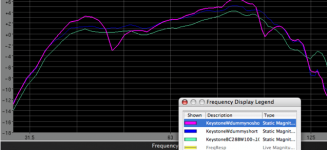
As another data point for FLH, the chart below shows one (raised 6 dB) and two of my Chorns (with a BW25/125 Hz filter), a cabinet like a shrunken Labhorn.
It agrees with the slight LF extension and slight HF attenuation or smoothing that is typical of multiple FLH. The 2003 test results show multiples of 2, 4 and 8 cabinets, a 13 dB range from 31.5 Hz to 160 Hz with a pair reduces to only 5 dB range with 8 cabinets, 31.5 having increased by 16 dB.
Thanks to DJM for doing the FLH/sim comparisons, I have included them again below.
I had been thinking Hornresp exaggerated the LF response of TH in multiples, while it appears in DJM’s comparison of the FLH that the LF agrees, while upper addition is in error.
Oddly, it does not appear that the LF corner lowered, while it does in the measured response.
Looking at Ivan Beaver’s 1, 2, & four TH-115 measurements, it is apparent that the TH LF corner does not change in multiples, but the upper response smooths out and does not increase a full 6 dB.
Ivan gave no indication of how the cabinets were arranged, arrangement can make a significant difference at the 10’ measurement distance that test was conducted.
Four cabinets with the mouths on the ground, four stacked 2x2 with mouths together, and four 2x2 with mouths apart will all give different upper frequency response.
The difference in array configuration will account for some differences between measured and Hornresp, the simulation (as far as I know) only considers the horn mouth as the size of the exit.
In actual build FLH generally have a mouth area close to cabinet frontal area, while TH often have a mouth area only half or less of the frontal area.
Large array size and shape make a big difference in response, programs like Meyers MAPP take those features into account.
Hornresp works very well for design, but large scale interaction really needs to be measured, even MAPP only works as a 2 dimensional model, while we live in a 3D world.
Art Welter
Attachments
I popped over here to read everyone's replies today and re-read my own. I realized that some of it may have been confusing, so I want to clarify this point:
To rephrase that part:
I don't think using a straight 6dB increase when doubling horns is the best approach because it doesn't match measurements. Maybe rolling off the top end by 3dB is a smidge too much, but then again, maybe not. We've seen several datasets that show the same trend, and it's at least a 2dB slope, even with large horns. Seems like smaller horns show this effect even more, but I haven't scrutinized them. They also look like they gain a decibel or two more than 6dB on the bottom end, not just lose a decibel or two on the top. Might be worth lining up all the relevant measurements available, side-by-side like Djim did, to look at them closer.
There's definitely an effect (or set of effects) that cause bass to get more increase (or higher frequencies to get less increase) when grouping basshorns closely together. My thinking is it's one or more of these three things, or perhaps a combination of all of them:
1. Mouth size getting closer to acoustical scale at LF (causing an efficiency increase at LF)
2. Reduced summing at HF because of acoustic distance (causing phase/summing reduction at HF)
3. Shift in the movement of the acoustic center (causing distance to change as a function of frequency)
I suppose the best approach would be to do more analysis to see which of these effects made the most difference, or if they all have to be calculated in the model. It would require the sizes and positions of the sound sources to be entered, and a set of formula that expressed these conditions to be applied. But I think that until and unless this kind of analysis can be done, probably a hard-coded "fudge factor" can be used. I don't think the increase should be 6dB across the board, but I also don't think a fixed rolloff slope always tracks measurements either. I think it might make sense to examine the data that you have, and see if an interpolated slope offset that takes mouth size into account might make sense.
I don't think using a straight 6dB bump when doubling horns is the best approach. Maybe 3dB is a smidge too much, but then again, maybe not. You've seen several datasets that show the same trend, and it's at least 2dB, even with large horns. Seems like smaller horns show this effect even more, but I haven't scrutinized them. Might be worth lining them all up, side-by-side like Djim did, to look at them closer...
To rephrase that part:
I don't think using a straight 6dB increase when doubling horns is the best approach because it doesn't match measurements. Maybe rolling off the top end by 3dB is a smidge too much, but then again, maybe not. We've seen several datasets that show the same trend, and it's at least a 2dB slope, even with large horns. Seems like smaller horns show this effect even more, but I haven't scrutinized them. They also look like they gain a decibel or two more than 6dB on the bottom end, not just lose a decibel or two on the top. Might be worth lining up all the relevant measurements available, side-by-side like Djim did, to look at them closer.
There's definitely an effect (or set of effects) that cause bass to get more increase (or higher frequencies to get less increase) when grouping basshorns closely together. My thinking is it's one or more of these three things, or perhaps a combination of all of them:
1. Mouth size getting closer to acoustical scale at LF (causing an efficiency increase at LF)
2. Reduced summing at HF because of acoustic distance (causing phase/summing reduction at HF)
3. Shift in the movement of the acoustic center (causing distance to change as a function of frequency)
I suppose the best approach would be to do more analysis to see which of these effects made the most difference, or if they all have to be calculated in the model. It would require the sizes and positions of the sound sources to be entered, and a set of formula that expressed these conditions to be applied. But I think that until and unless this kind of analysis can be done, probably a hard-coded "fudge factor" can be used. I don't think the increase should be 6dB across the board, but I also don't think a fixed rolloff slope always tracks measurements either. I think it might make sense to examine the data that you have, and see if an interpolated slope offset that takes mouth size into account might make sense.


Hi Djim,
The one in Post #1324 (and in Art's Post #1322) would be a great example if it didn't have obvious measurement problems in the red curve. The 80-120Hz hump appears compressed, and the 150(?)Hz dip has almost disappeared, that looks more like a measurement problem than proper combining of SPL values. So what else is wrong with that particular data set?
This stuff is not just difficult to analyze, it's also really difficult to measure that accurately.
Regards,
Last edited:
Hi Oliver,Hi Djim,
The one in Post #1324 (and in Art's Post #1322) would be a great example if it didn't have obvious measurement problems in the red curve. The 80-120Hz hump appears compressed, and the 150(?)Hz dip has almost disappeared, that looks more like a measurement problem than proper combining of SPL values. So what else is wrong with that particular data set?
This stuff is not just difficult to analyse, it's also really difficult to measure that accurately.
Regards,
I agree, the red line looks way too flatten out and limited above 80Hz. Probably a mic and/or mic amp problem of the measuring system. 'Normally' you would expect an downward motion is followed by upraise motion (you always see such balance). The downwards motion is way bigger than the upward motion in the dip which is a prove of compression in the measuring system. However below 80Hz I do believe the red line is accurate and follows the principles of horn size theory. Also the dual stack seems to keep it's level below the compression threshold of the red line.
Nothing wrong with Ivan's data set, note how it results in a similar response to my 2003 FLH Chorn tests shown in post #1322 in the upper response.Hi Djim,
The one in Post #1324 (and in Art's Post #1322) would be a great example if it didn't have obvious measurement problems in the red curve. The 80-120Hz hump appears compressed, and the 150(?)Hz dip has almost disappeared, that looks more like a measurement problem than proper combining of SPL values. So what else is wrong with that particular data set?
This stuff is not just difficult to analyze, it's also really difficult to measure that accurately.
Regards,
Upper response becomes flat as a pancake, because the upper humps are attenuated, likely because of interference patterns.
However, the FLH low corner obviously goes down in multiples, but the TH obviously does not.
As I said in that post, and will repeat, the difference in array configuration will account for some differences between measured and Hornresp.
Hornresp can't be expected to model array shapes.
Last edited:
Multiple Speakers
Hi Everyone,
Many thanks for all your recent inputs. While there are some understandable differences in the sets of data that have been provided, on balance the measured results would appear to be closer to the predictions made by the proposed new Hornresp multiple speakers model, rather than the existing model.
To summarise the differences between the two models:
Two speakers connected in parallel compared to single speaker - same voltage:
Existing model:
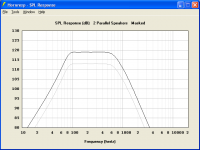
+6dB at low frequencies and +3dB at high frequencies (see Old_2P.png).
Proposed model:
+6dB at low frequencies and +6dB at high frequencies (see New_2P.png).
Two speakers in connected in series compared to single speaker - same voltage:
Existing model:
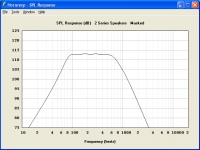
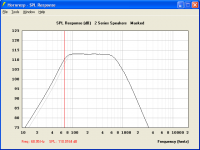
+0dB at low frequencies and -3dB at high frequencies (see Old_2S.png).
Proposed model:
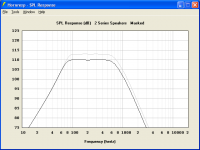
+0dB at low frequencies and +0dB at high frequencies (see New_2S.png).
The results generated by the proposed new model are consistent with AkAbak predictions and the standard SPL summing rules for coherent / correlated signals. The new model does not however, allow for bass extension due to mutual coupling of multiple horn mouths - it seems from measurements that this is not really an issue anyway, in that the real-world coupling between adjacent speakers is not as tight as perhaps first thought.
Please note that these are the only two model options under consideration - I not want to deviate from the standard models in an attempt to better fit measured data. Also, I don’t want to include both options in Hornresp - it could be confusing for some users, and make comparison of results more difficult.
If anyone believes that it makes more sense to retain the old model rather than change to the proposed new model, could they please let me know as soon as possible, either by way of this thread or by private e-mail to the address given on the Hornresp web page. Thanks.
Kind regards,
David
Hi Everyone,
Many thanks for all your recent inputs. While there are some understandable differences in the sets of data that have been provided, on balance the measured results would appear to be closer to the predictions made by the proposed new Hornresp multiple speakers model, rather than the existing model.
To summarise the differences between the two models:
Two speakers connected in parallel compared to single speaker - same voltage:
Existing model:
+6dB at low frequencies and +3dB at high frequencies (see Old_2P.png).
Proposed model:
+6dB at low frequencies and +6dB at high frequencies (see New_2P.png).
Two speakers in connected in series compared to single speaker - same voltage:
Existing model:
+0dB at low frequencies and -3dB at high frequencies (see Old_2S.png).
Proposed model:
+0dB at low frequencies and +0dB at high frequencies (see New_2S.png).
The results generated by the proposed new model are consistent with AkAbak predictions and the standard SPL summing rules for coherent / correlated signals. The new model does not however, allow for bass extension due to mutual coupling of multiple horn mouths - it seems from measurements that this is not really an issue anyway, in that the real-world coupling between adjacent speakers is not as tight as perhaps first thought.
Please note that these are the only two model options under consideration - I not want to deviate from the standard models in an attempt to better fit measured data. Also, I don’t want to include both options in Hornresp - it could be confusing for some users, and make comparison of results more difficult.
If anyone believes that it makes more sense to retain the old model rather than change to the proposed new model, could they please let me know as soon as possible, either by way of this thread or by private e-mail to the address given on the Hornresp web page. Thanks.
Kind regards,
David
Attachments

I don't see how one can invalidate the coupling calculations without also claiming there would be a problem with the validity of radiation angle calculations?
Seems like a lack of understanding problem to me WRT what is acoustically sizable/correct. IMO it is entirely possible to build an array of acoustically small devices and create an acoustically large result. Having the ability to predict the change in driver loading is important to me.
Thanks for all the hard work David.
Hi,
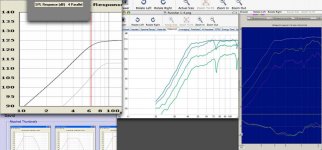
Looking at Djim's higher resolution picture of the DSL-TH115 SPL measurements a little closer: it seems to me that at 20Hz the difference between the lines is more than 6dB, the same holds true for 30 and 40 Hz, at 50 Hz the red line is already showing compression problems, the brown to blue difference is about 6dB. Anyway, I don't have the data sets to look at, I don't have more than a rudimentary idea of the measurement setup, and - as much as I like to ponder about audio and loudspeakers - I certainly would not base any conclusions as to the validity of a simulation software on this graph.
Measuring at 10m/100W is not a valid way to get data to compare to the results of a small signal TS/no losses/no compression simulation in software. It's a great way to evaluate the behaviour of PA loudspeakers and systems, and to compare different loudspeakers or systems to each other; provided the measurement system response is very well known.
Thanks to everybody's observant input David found the problem in his software, and his proposed model should get closer to the "measured results" and to general expectations.
I just hope we will not loose accuracy in the simulation of individual speakers driven internally by multiple drivers.
Either way though, Hornresp is a great tool that makes a lot of analysis possible to laymen like me. Without it (or Akabak) I would be reduced to the "good old days" of calculate/cut/try/measure when it comes to horns and all the variations on tapped enclosures, and who's got the time?
Regards,
David,Hi Everyone,
Many thanks for all your recent inputs. While there are some understandable differences in the sets of data that have been provided, on balance the measured results would appear to be closer to the predictions made by the proposed new Hornresp multiple speakers model, rather than the existing model.
To summarise the differences between the two models:
Two speakers connected in parallel compared to single speaker - same voltage:
Existing model:
+6dB at low frequencies and +3dB at high frequencies (see Old_2P.png).
Proposed model:
+6dB at low frequencies and +6dB at high frequencies (see New_2P.png).
Two speakers in connected in series compared to single speaker - same voltage:
Existing model:
+0dB at low frequencies and -3dB at high frequencies (see Old_2S.png).
Proposed model:
+0dB at low frequencies and +0dB at high frequencies (see New_2S.png).
Kind regards,
David
This has been a fascinating exchange.
The coherent addition of 6 dB is proven with two small two way horn speakers measured at 2 meters as shown in post 1264.
The 0 dB gain of doubling series cabinets is proven by the measurements of one and two dual Lab 12 cabinets in series in post 1322, the net gain of two is about .75 dB over the measured range.
Important points:
A)Because of path length difference, large flat front arrays measured close relative to the array frontal width will cause upper frequency incoherence which will result in less additional gain (or even attenuation) in multiples.
B)A large array becomes an additional boundary as the lower wavelength approaches the array width, increasing forward directivity, which imparts gain relative to the frontal area in addition to the 6 dB coherent addition.
An example of boundary gain can be seen in post 1244, a shorted non-powered cabinet along side a powered cabinet increases response by about 1 dB from 30 Hz to 120 Hz.
Going from one to two ported cabinets of half that frontal area (WSdualLab12) results in a .66 dB LF gain.
Looking at Djm’s rendering of Wayne’s FLH pair in post 1322, the pair increase by 2 dB in the LF, both the FLH and TH sets of cabinets are almost the same exact frontal area.
In #1324, Djim renders the 1-4 difference in the TH-115 as 2.5 dB.
This small LF difference spread from four different cabinet types measured by three individuals indicates that frontal area increasing boundary size increasing forward directivity is behind the LF increase over 6 dB, not horn related phenomenon.
Even though I’d prefer the change from the old model, the proposed model will actually be less representative of one meter multiple large cabinet measurements, though it will be a bit closer to 10 meter measurements.
Unfortunately, neither model will exactly correspond to real world multiple cabinet results because of the increased boundary size and HF cancellation.
I’d suggest mentioning points A & B if you do decide to implement the change.
After reviewing all this data, I do agree with you that TH don’t require a different set of rules from FLH or BR.
Multiples of different bass cabinet designs will exhibit different response variations from a single, and Hornresp won’t be predictive of those differences.
Hornresp will still be a great simulation program, and better for the change.
Art Welter
wil this also affect 0,5 ,1 ,2,4 pi settings ,in the graph?Hi Everyone,
Many thanks for all your recent inputs. While there are some understandable differences in the sets of data that have been provided, on balance the measured results would appear to be closer to the predictions made by the proposed new Hornresp multiple speakers model, rather than the existing model.
To summarise the differences between the two models:
Two speakers connected in parallel compared to single speaker - same voltage:
Existing model:
+6dB at low frequencies and +3dB at high frequencies (see Old_2P.png).
Proposed model:
+6dB at low frequencies and +6dB at high frequencies (see New_2P.png).
Two speakers in connected in series compared to single speaker - same voltage:
Existing model:
+0dB at low frequencies and -3dB at high frequencies (see Old_2S.png).
Proposed model:
+0dB at low frequencies and +0dB at high frequencies (see New_2S.png).
The results generated by the proposed new model are consistent with AkAbak predictions and the standard SPL summing rules for coherent / correlated signals. The new model does not however, allow for bass extension due to mutual coupling of multiple horn mouths - it seems from measurements that this is not really an issue anyway, in that the real-world coupling between adjacent speakers is not as tight as perhaps first thought.
Please note that these are the only two model options under consideration - I not want to deviate from the standard models in an attempt to better fit measured data. Also, I don’t want to include both options in Hornresp - it could be confusing for some users, and make comparison of results more difficult.
If anyone believes that it makes more sense to retain the old model rather than change to the proposed new model, could they please let me know as soon as possible, either by way of this thread or by private e-mail to the address given on the Hornresp web page. Thanks.
Kind regards,
David
I just hope we will not loose accuracy in the simulation of individual speakers driven internally by multiple drivers.
Hi Oliver,
You can rest easy - the multiple drivers model remains the same
") .
.Kind regards,
David
wil this also affect 0,5 ,1 ,2,4 pi settings ,in the graph?
Hi epa,
No, it won't. Changing the Ang setting will have the same effect as it does now.
Kind regards,
David
Multiple Speakers
Hi Everyone,
Thanks for your comments on the relative merits of the old and new models. Taking into account all the feedback received to date, the following alternative new model has been developed which allows for bass extension due to mutual coupling of multiple horn mouths (other than for tapped horns and bass-reflex systems), and also still remains consistent with the standard SPL summing rules for coherent / correlated signals.
Screenprint New1_2P.png shows two front-loaded horn speakers connected in parallel, compared to a single speaker with the same drive voltage. The -3dB point for the two speakers in parallel is 69Hz, as shown. The -3dB point for the single speaker is 77Hz.
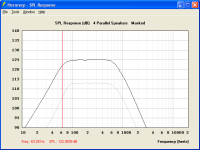
Screenprint New1_4P.png shows four front-loaded horn speakers connected in parallel, compared to a single speaker with the same drive voltage. The -3dB point for the four speakers in parallel is 63Hz, as shown. The -3dB point for the single speaker is 77Hz.
Screenprint New1_2S.png shows two front-loaded horn speakers connected in series, compared to a single speaker with the same drive voltage. The -3dB point for the two speakers in series is 69Hz, as shown (interestingly - the same as for the two parallel speakers). The -3dB point for the single speaker is 77Hz.
Screenprint New1_4S.png shows four front-loaded horn speakers connected in series, compared to a single speaker with the same drive voltage. The -3dB point for the four speakers in series is 63Hz, as shown (interestingly - the same as for the four parallel speakers). The -3dB point for the single speaker is 77Hz.
The alternative new model seems to "tick most (if not all) of the boxes" as I currently understand them. Can anyone see any problems in adopting the alternative new model in preference to either the existing model or the original new model?
Based on earlier feedback, multiple tapped horns and bass-reflex systems in the alternative new model currently do not have the bass extended, but this can be readily changed if required to make them perform the same as for other systems - with the bass extended.
Could Art in particular, please comment on whether or not tapped horns and / or bass-reflex speakers should be treated any differently to other speaker types in the alternative new model - the available data now seems to be a bit inconclusive in this regard.
As you may have gathered, I have not been getting much sleep lately....
Kind regards,
David
Hi Everyone,
Thanks for your comments on the relative merits of the old and new models. Taking into account all the feedback received to date, the following alternative new model has been developed which allows for bass extension due to mutual coupling of multiple horn mouths (other than for tapped horns and bass-reflex systems), and also still remains consistent with the standard SPL summing rules for coherent / correlated signals.
Screenprint New1_2P.png shows two front-loaded horn speakers connected in parallel, compared to a single speaker with the same drive voltage. The -3dB point for the two speakers in parallel is 69Hz, as shown. The -3dB point for the single speaker is 77Hz.
Screenprint New1_4P.png shows four front-loaded horn speakers connected in parallel, compared to a single speaker with the same drive voltage. The -3dB point for the four speakers in parallel is 63Hz, as shown. The -3dB point for the single speaker is 77Hz.
Screenprint New1_2S.png shows two front-loaded horn speakers connected in series, compared to a single speaker with the same drive voltage. The -3dB point for the two speakers in series is 69Hz, as shown (interestingly - the same as for the two parallel speakers). The -3dB point for the single speaker is 77Hz.
Screenprint New1_4S.png shows four front-loaded horn speakers connected in series, compared to a single speaker with the same drive voltage. The -3dB point for the four speakers in series is 63Hz, as shown (interestingly - the same as for the four parallel speakers). The -3dB point for the single speaker is 77Hz.
The alternative new model seems to "tick most (if not all) of the boxes" as I currently understand them. Can anyone see any problems in adopting the alternative new model in preference to either the existing model or the original new model?
Based on earlier feedback, multiple tapped horns and bass-reflex systems in the alternative new model currently do not have the bass extended, but this can be readily changed if required to make them perform the same as for other systems - with the bass extended.
Could Art in particular, please comment on whether or not tapped horns and / or bass-reflex speakers should be treated any differently to other speaker types in the alternative new model - the available data now seems to be a bit inconclusive in this regard.
As you may have gathered, I have not been getting much sleep lately...
.Kind regards,
David
Attachments


Good stuff here. I have only briefly skimmed through.
Has anyone read the AES paper by Don Keele Maximum Efficiency of Direct Radiator Loudspeakers? Obviously we are comparing various other alignments here not just DR's but there seems to be a lot of common overlap. Some things that I feel may have impact...Theoretical maximum efficiency is much more easily met at higher frequencies first. Secondly the size of the radiator/s involved relative to the frequency has impact on the maximum efficiency possible. Thirdly the size, shape or area of the radiator/s involved can also have impact on how far away from them is considered to be "direct" or nearfield sound. This would be the "bubble" that Tom D. sometimes mentions. A larger radiation area gives a larger further extending bubble. This probably also has some effect on the rate of drop off with distance according to the inverse square law. These are just some hunches that I have. I have observed some strange things measuring subs.
FLH's have the largest radiator area usually.
Hi Everyone,
Thanks for your comments on the relative merits of the old and new models. Taking into account all the feedback received to date, the following alternative new model has been developed which allows for bass extension due to mutual coupling of multiple horn mouths (other than for tapped horns and bass-reflex systems), and also still remains consistent with the standard SPL summing rules for coherent / correlated signals.
The alternative new model seems to "tick most (if not all) of the boxes" as I currently understand them. Can anyone see any problems in adopting the alternative new model in preference to either the existing model or the original new model?
Based on earlier feedback, multiple tapped horns and bass-reflex systems in the alternative new model currently do not have the bass extended, but this can be readily changed if required to make them perform the same as for other systems - with the bass extended.
Could Art in particular, please comment on whether or not tapped horns and / or bass-reflex speakers should be treated any differently to other speaker types in the alternative new model - the available data now seems to be a bit inconclusive in this regard.
As you may have gathered, I have not been getting much sleep lately...
Kind regards,
David
Get some sleep, things will be more clear then!
From the observations gleaned in the recent past posts, (Djim’s handiwork has been particularly helpful) and over the years of listening and measuring, it appears to me there is very little difference in the LF response gain between multiple cabinets whether BR, TH, or FLH.
From a model perspective, I see no evidence supporting an almost 1/3 octave lowering of the low corner of four FLH compared to one, though evidence supports a minor LF corner (F3) lowering in multiple FLH.
The important boxes not ticked are the reduction of upper frequencies in multiple cabinets, and the LF increase due to the larger boundary created by multiple cabinets.
I doubt those two issues could be addressed in Hornresp without major code addition, though the boundary issue might be addressed with a “cabinet frontal area” addition.
Presently, this important consideration is not included, but can be simulated by “stretching” the last horn segment, though that still does not agree with measured results.
As a mental construct, (or a Hornresp input) consider two sealed cabinets, each the same volume, but one having a frontal area of 10 x10 meters , the other 1/2 meter x 1/2 meter square.
The 10 x10 meter cabinet could be considered a 180 x180 degree horn, or a sealed box, but regardless of what it is called, the two identical volume sealed boxes will both have a drastically different measured response in free space and half space.
sebDIY posted charts in 1311, the Punisher and the TH-115 both suffer from the “unplugged cabinet syndrome”.
Doober originally posted the Punisher plots, he wrote 17 December 2009 at 5:38pm:
“Shortly after posting the plots I realized what was causing the dips. For the plot of one box I had an unpowered box sat on top. For the plot of 3 boxes I had a stack of four, one unpowered. It would seem that the unpowered box is sucking a bit of the energy from the powered one at those points. The fact that the dips are smaller on the 3 cabs plot backs this up.”
An example of the above problem and boundary gain can be seen in post 1244, a shorted non-powered cabinet along side a powered cabinet increases response by about 1 dB from 30 Hz to 120 Hz over the single free standing cabinet, picture included again.
From all the data it is apparent FLH do increase slightly over +6 for doubling in the LF, and the low corner goes down by only a 1 or 2 Hz.
Going from 2 to four, another slight increase over +12 is observed, but none of the examples shown seem to be over +15, a 3 dB increase over what would be expected.
TH also exhibit the slight increase in LF over +6 or +12, but no LF corner decrease.
In light of the obvious difference an unpowered cabinet makes in reducing level at some frequencies and adding level at others, I’d suggest the deviation of +6 or +12 gain at upper bass horn frequencies may be due to diffraction into adjacent cabinet’s mouth area causing the reflected output to be out of phase, progressively attenuating upper frequencies, which results in a flatter response in multiples when combined with boundary effect increases at low frequencies.
Whatever is behind the upper attenuation in multiple bass horns, and whether any model can be made to account for them, they are apparent in measurement.
Your new proposal lowers the low corner from 77 Hz to 69 for 2 cabinets, an 8 Hz difference, then down to 63 Hz for 4 horns, almost a 1/3 octave decrease in low corner.
None of the measurements indicate a LF corner change near as drastic as that, the model seems to be about 4 times measured results for the 12Pi, Chorn, Punisher, Labhorns etc.
As can be seen clearly in my “dummy cabinet” picture, a baffle doubling frontal area adds 1 dB.
When the ground plane mirror reflection is considered, doubling frontal area quadruples area.
This would make for a different LF extension in full space compared to half space, probably not part of the Hornrep model.
The large boundary increases directivity so forward gain is increased, while level to the sides and behind is reduced, which can be measured with any cabinet type of large array.
“Barn doors” were often added to theater horns for this reason.
I have included a revision of my own findings- my written Chorn charts previously posted had some clerical errors and a stupid amplifier mistake which became apparent after comparing them to later Smaart charts.
Art Welter
Attachments
- Home
- Loudspeakers
- Subwoofers
- Single sheet TH challenge