If you measure ts for a driver and it differs from specs, take your measured ts and compute a response curve.
If you then measure the response curve (nearfield) it should match fairly well, if your measured ts values are good.
(you can use the same box , assuming you used the sealed box method)
If you then measure the response curve (nearfield) it should match fairly well, if your measured ts values are good.
(you can use the same box , assuming you used the sealed box method)
If you measure ts for a driver and it differs from specs, take your measured ts and compute a response curve.
If you then measure the response curve (nearfield) it should match fairly well, if your measured ts values are good.
(you can use the same box , assuming you used the sealed box method)
Yes I have already put my measured TS parameters into the MJK worksheet for my cabinet, and the results are very poor. No amount of tweaking the port dimensions can compensate.
GDO, how can you have in post #60 the same Qes, Qms, yet different Qts? If you correct the Qes values in respect to Qts, the difference in SPL is 3,5 dB.
No, as you know in winisd you have enough with 3 params to get the transfer function: fs, Qts, and vas.
So i just edited one driver of the library (named ACI-SV12) changing only those 3 params and made the 2 sims, one with cs's measured ( fs,qts,vas) and same for those 3 params taken from the datasheet.
The only "tweak" i did is allow for more loses from the box when using cs's params to soften a slight bump, with Ql=3 instead of standard Ql=7.
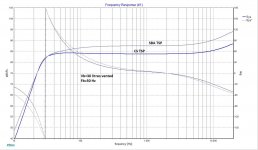
Differences between official and privately measured TSP by CS
I reckon this kind of a comparison speaks a little better what the main issue may be. I have simulated it in Woofer Box Model and Circuit Designer what the response would have been like with manufacturer data and the ones measured by CS member as shown in sample one of the opening post, then exported it as frd in XSim. Even though the data in frd's were only until 1000 Hz mark, XSim plotted it all the way up.
I reckon this kind of a comparison speaks a little better what the main issue may be. I have simulated it in Woofer Box Model and Circuit Designer what the response would have been like with manufacturer data and the ones measured by CS member as shown in sample one of the opening post, then exported it as frd in XSim. Even though the data in frd's were only until 1000 Hz mark, XSim plotted it all the way up.
Attachments
Last edited:
Maybe I missed something on post #60 but Qts can not possibly be larger than Qes. The first set of data has to be wrong.
I repeat: Winisd only takes into account Fs Qts and Vas to calculate the transfer function, you can change all the other parameters, their value is ignored and the transfer function ( what they call Gain) will remain the same.
Just have a try and check by yourself...
")
Obviously, to get the SPL curve you need more data, especially BL, though it can be calculated here from Qes, but i am too lazy and the transfer function is far enough for me to know if this driver is usable or not for a BR regardless of possible TS params issues...
Last edited:
But if you pay real money for quality drivers, you kind of want what you expect.
Yes but what if you are not knowledgeable enough to really assess how good or bad is the quality of the drivers you have been delivered?
Being the proud owner of a DATS V2 does not make of you any trustable expert, whatever the money you paid for the... drivers and the ... measuring gear!
Every day i hate more mass market, mass marketing and social networks!
Last edited:
I guess it won't...
At least i bet Fs and Qts will be significantly higher, Cms lower ( probably as much a 50%), and Vas lower.
But hopefully time will cure it all. So, trust the (good) manufacturers!
http://www.almainternational.org/ya...loudspeaker_suspensions-klippel.106164342.pdf
At least i bet Fs and Qts will be significantly higher, Cms lower ( probably as much a 50%), and Vas lower.
But hopefully time will cure it all. So, trust the (good) manufacturers!
Why is the suspension the weakest loudspeaker part ?
How to measure the long-term stability of soft parts ?
How to consider the influence of the mechanical load on the aging ?
How to separate the early break-in process from fatigue ?
How to predict the final loss of stiffness ?
The mechanical suspension becomes more and more compliant over time changing
the loudspeaker properties (e.g. resonance frequency) significantly. This aging
process is reproducible and the decay of the stiffness can be modeled by
accumulating the apparent power supplied to the suspension part and using an
exponential relationship. The free parameters of this model are estimated from
empirical data provided by on-line monitoring or intermittent measurements during
regular power tests or other kinds of long-term testing. The identified model can be
used to predict the load-induced aging for music or test signals having arbitrary
spectral properties. New characteristics are being introduced which simplify the
quality assessment of suspension parts and separate mechanical fatigue from the
initial break-in effect. Practical experiments are performed to verify the model and
to demonstrate the diagnostic value for selecting optimal suspension parts providing
sufficient long-term stability.
http://www.almainternational.org/ya...loudspeaker_suspensions-klippel.106164342.pdf
Last edited:
I was just thinking if one used an 8 ohm resistor or a resistor of a measured value near to that for calibration, rather than the supplied 1K ohm resistor that comes with WT3, one might get better results when testing T/S parameters of a driver.
I don't have WT3 as yet but was considering buying it in the near future so I can't try it for myself. It might be worth a try.
C.M
I don't have WT3 as yet but was considering buying it in the near future so I can't try it for myself. It might be worth a try.
C.M
I reckon this kind of a comparison speaks a little better what the main issue may be. I have simulated it in Woofer Box Model and Circuit Designer what the response would have been like with manufacturer data and the ones measured by CS member as shown in sample one of the opening post, then exported it as frd in XSim. Even though the data in frd's were only until 1000 Hz mark, XSim plotted it all the way up.
Hi Lojzek,
My cabinets are (or will be) floor standing MLTL types, so a simple box model simulator won't give a very accurate prediction. They don't take into account the cabinet geometry and associated standing wave effects, or the frequency dependent absorption on the stuffing material, or the fact that the stuffing may not be uniformly distributed. You really have to use a true TL simulator to get a reliable result. I use the MJK software.
The drivers as they stand probably would work very well in a conventional TL (either Bailey or tapered), but I already have the wood cut to size for the cabinets (at significant expense), so I don't want to have to start from scratch.
Chris.
...but I already have the wood cut to size for the cabinets (at significant expense), so I don't want to have to start from scratch.
Chris.
Ha, i am quite sure that the guys at Intertechnik will be generous enough to refund this too!
Btw, don't know why you need a weird and tricky MLTL for a driver like this....
Want to reach DC?I was just thinking if one used an 8 ohm resistor or a resistor of a measured value near to that for calibration, rather than the supplied 1K ohm resistor that comes with WT3, one might get better results when testing T/S parameters of a driver.
I don't have WT3 as yet but was considering buying it in the near future so I can't try it for myself. It might be worth a try.
C.M
Yes that's a very good point. It does beg the question why Dayton chose such a high value as their reference impedance, given that few drivers would go above 100 ohms at resonance.
Yes that's a very good point. It does beg the question why Dayton chose such a high value as their reference impedance, given that few drivers would go above 100 ohms at resonance.
It's called current drive, and once again you will have to trust the designers know what they do, better than you can imagine...
WT Pro uses voltage drive, because it comes with a power amplifier which is necessary as an almost pure voltage source. The opam at the output of a wimpy soundcard like WT 2, or my UCA202, cannot do that, though a 150 ohms resistor seems to be enough in this case.
Anyway different methods will lead to different results and squared minded guys will always feel disappointed in a field where absolute truth does not exist, except maybe using destructive methods to directly measure some ( but not all...) parameters, like mass, or magnetic flux density. But even a simple notion like diameter will need an aproximation (or a procedure applied by strict convention), no to mention suspension stiffness...
So that key parameters like Fs, Qts, or Vas will always be in the air, requiring patience, prudence, resilience and forgiveness to the designers, qualities seldom found among discerning and demanding dyiers, especially in the case of absolute beginners ...
Last edited:
It's called current drive, and once again you will have to trust the designers know what they do, better than you can imagine...
After checking DATS doc, i must edit this because i now realize that the 1K resistor is not used as reference resistor during loudspeaker measurement but simply to check that DATS is correctly adjusted, and this resistor does not play any role in further measurements, so that its value is probably of no importance at all.
That said, i find the white paper is not fair when stating that the signal level is not important for measurement and they pretend to demonstrate it with an example of a driver of their own measured with a maximum level of -10dbu (.25V) at resonance and speaker terminals, when industry standard is 1V and their gear cannot deliver that level and above.
No wonder if at these measurement levels people who use their gear systematically conclude that their samples are off their specs, as happens with 90% of the measurements realized by Audioexcite as an example, with drastically lower Cms, higher Fs ant Qts.
Last edited:
- Home
- Loudspeakers
- Multi-Way
- SB Acoustics TS parameters dreadfully inaccurate