Thanks for trying to help me understand this guys. But, I am still not quite getting it. A breakup mode at 6kHz occurs at 6kHz an not before. How is the shape of the breakup at 6kHz (which hasn't happened yet), mirrored in the distortion products from excitation at 2kHz? I am going to have to read up on this but it's not ever been apparent in my other drivers. RS225-8 doesn't exhibit this. I mean this is low level 1v rms - shouldn't be seeing anything.
It's not a sub-harmonic, it's straight-forward HD. If you have a fundamental tone at 2KHz, your 3rd harmonic will be at 3KHz. Now if you have a peak in your response at 3KHz, you will correspondingly have a peak in HD3. This is exactly what we are seeing. HD is a function of frequency response, and other things too of course.
Try going over to Zaph's place and comparing frequency response with HD3 and HD5 for various drivers. Some show it very clearly, others less so.
There's no error in your setup. To get round this problem, you can either cross very low, or apply some sort of cone/surround damping to ameliorate the break-up.
Shouldn't this read 6 KHz instead of 3 KHz? The 3rd harmonic of 2 KHz is 6 KHz, right?
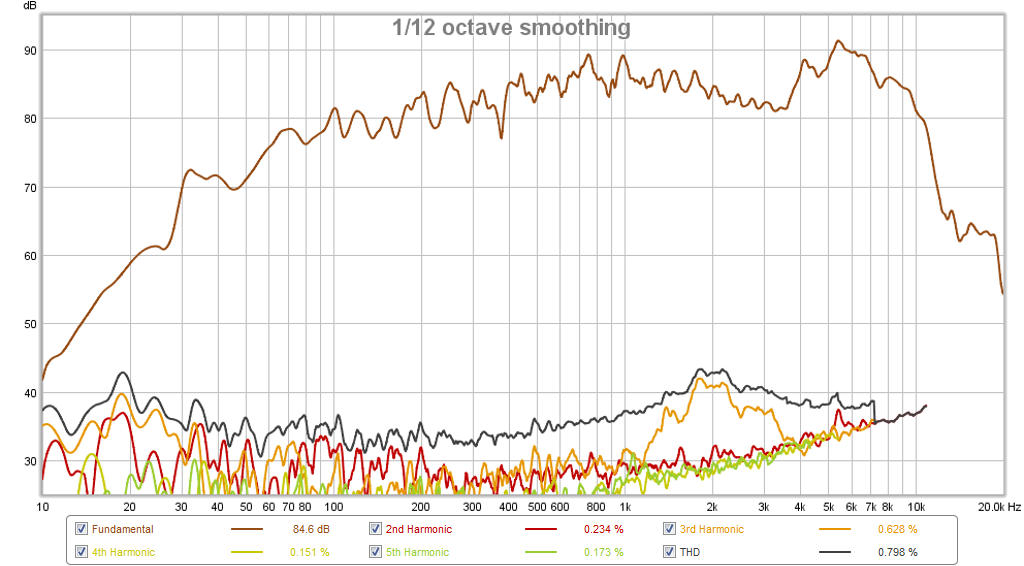
Like this plot shows:
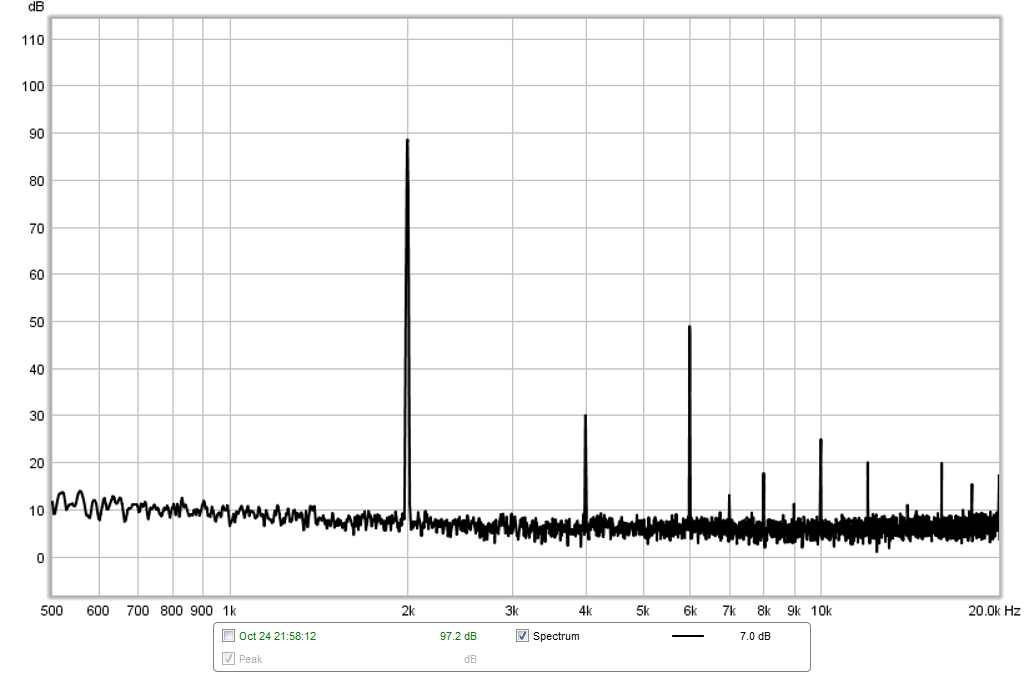
Exciting 2 KHz, gives a small 2nd harmonic peak at 4 KHz, and a big 3rd harmonic at 6 KHz.
Thanks for trying to help me understand this guys. But, I am still not quite getting it. A breakup mode at 6kHz occurs at 6kHz an not before. How is the shape of the breakup at 6kHz (which hasn't happened yet), mirrored in the distortion products from excitation at 2kHz? I am going to have to read up on this but it's not ever been apparent in my other drivers. RS225-8 doesn't exhibit this. I mean this is low level 1v rms - shouldn't be seeing anything.
It isn't occurring at 6 KHz. Each time this driver plays a 2 KHz note, the cone "sings" at 6 KHz. That's what your IMD plot shows as well. REW shows you the normal FR plus the note "sung" by the cone at 6 KHz (which was a by-product of the 2 KHz note it played). REW just adds it in the plot, that's why the peak in FR mimics the 3rd order distortion.
So as long as you excite 2 KHz, it will play a pretty loud note at 6 KHz simultaneously.
Thanks for trying to help me understand this guys. But, I am still not quite getting it. A breakup mode at 6kHz occurs at 6kHz an not before. How is the shape of the breakup at 6kHz (which hasn't happened yet), mirrored in the distortion products from excitation at 2kHz?
It is happening because the HD3 of 2KHz is a 6KHz signal.
Shouldn't this read 6 KHz instead of 3 KHz? The 3rd harmonic of 2 KHz is 6 KHz, right?
Yep, my mistake.
I am working with PE Tech Support on this. They might get me replacement drivers or confirm it is just normal - in which case I either have to crossover much lower below 2kHz and have a gap filler mid driver rather than a hole filler mid. Or get a different driver.
I get it now - the cone generates (or sings) content at 4kHz and 6kHz when excited at 2kHz just like the RTA plot shows.
I get it now - the cone generates (or sings) content at 4kHz and 6kHz when excited at 2kHz just like the RTA plot shows.
Maybe this is what I need? 4x the price! 
https://www.madisoundspeakerstore.c...ak-revelator-18w/8531g-00-7-mid-woofer-8-ohm/
Or this:
https://www.madisoundspeakerstore.c...19p-4-7.5-egyptian-papyrus-cone-woofer-4-ohm/
https://www.madisoundspeakerstore.c...ak-revelator-18w/8531g-00-7-mid-woofer-8-ohm/
Or this:
https://www.madisoundspeakerstore.c...19p-4-7.5-egyptian-papyrus-cone-woofer-4-ohm/
Last edited:
My measurements of the RS100 show a spike in 3rd harmonic distortion at 5khz which corresponds to the peak at 15khz. X, I don't remember what your distortion plot looks like for that driver but I imagine you must have found something similar...
I will have to take a look at that data again but missed it the first time. If you saw it then I guess this is common.
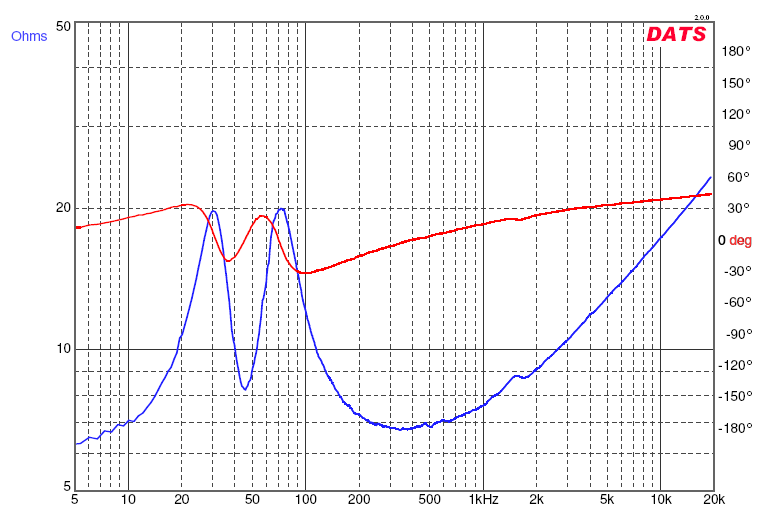
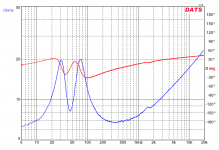
Impedance measurement of RS180P and PR
Using DATS I get the passive radiator tuning frequency as 45Hz, very close to the simulated prediction of 44Hz. There is a squiggle right near 1.7khz, probably the transition of the cone from pistonic to bending modes.
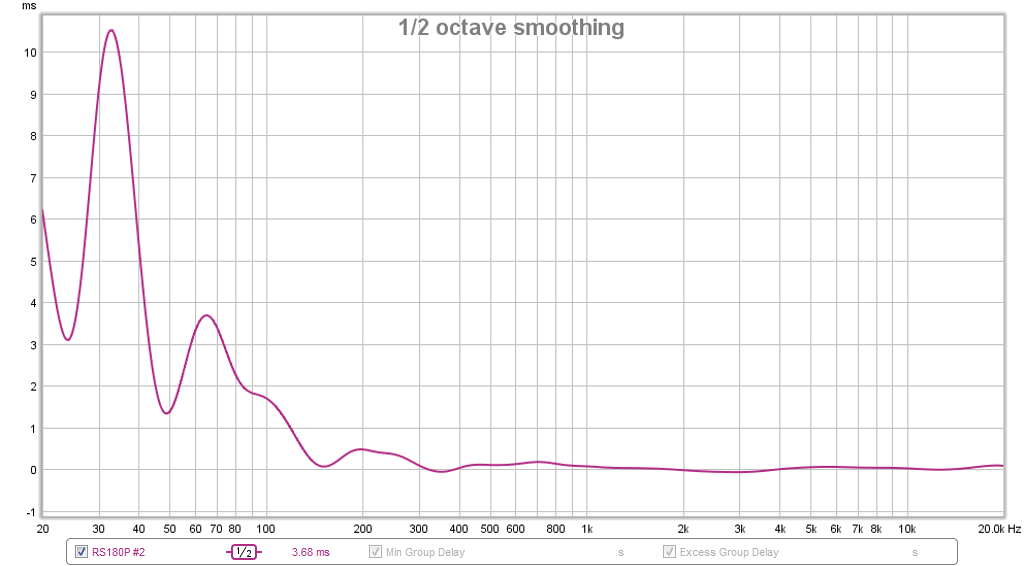
And here is the measured group delay (1/2 oct smoothing) showing a very nice result - although climbs near 30Hz, not much output at the frequency:
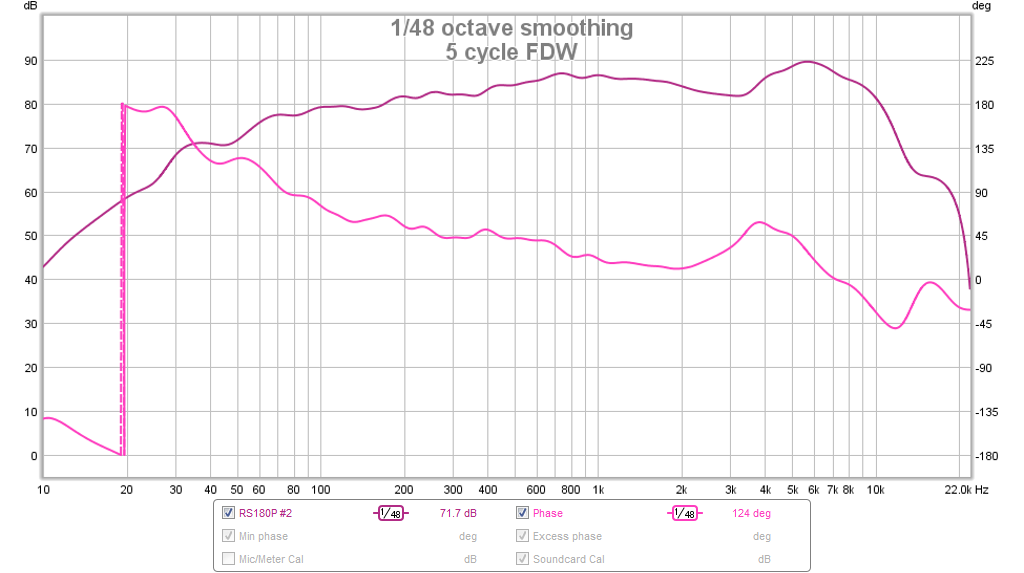
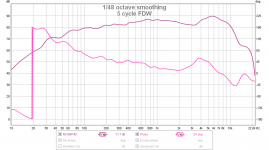
And here is the measured phase with 5 cycles FDW applied:
Using DATS I get the passive radiator tuning frequency as 45Hz, very close to the simulated prediction of 44Hz. There is a squiggle right near 1.7khz, probably the transition of the cone from pistonic to bending modes.
And here is the measured group delay (1/2 oct smoothing) showing a very nice result - although climbs near 30Hz, not much output at the frequency:
And here is the measured phase with 5 cycles FDW applied:
Attachments

Last edited:
The wiggle in the impedance is almost exactly where the peak of the distortion spike is.
Be careful of the very hard paper cones as they act just like metal and have very pronounced breakup. Look at the difference in crossover troels used on the SB61 speakers for the different cones. 4th order was needed to suppress the breakup on the hard cones.
I know you are designing for passive but for a test use your minidsp to try a few crossovers points and slopes and measure the distortion with the crossover in place if you can drop that area by 6dB then it is likely that it will almost go below the overall distortion curve. It might look much better then.
Definitely will miniDSP beta test the XO prior to implementing in passive hardware. I am really curious what the sound difference with and without hole filler mod is going to sound like. I think the transient snap or attack with the transient perfect hole-filler configuration will be apparent on tracks with live mic'd drums or stand up bass, acoustic guitar, etc.
My initial crude passive XO from the 10F/RS225 project was used just to get an impression of this setup and the tweeter/waveguide is very very nice sounding. The RS180P and dual passive radiators are getting some nice bass - not deep but 60Hz or so is enough to capture kick drums with some effect. It's a surprisingly powerful bass output level for a small woofer.
My initial crude passive XO from the 10F/RS225 project was used just to get an impression of this setup and the tweeter/waveguide is very very nice sounding. The RS180P and dual passive radiators are getting some nice bass - not deep but 60Hz or so is enough to capture kick drums with some effect. It's a surprisingly powerful bass output level for a small woofer.
Last edited:

Hello X, maybe inappropriate but I am still going to try a Special Request:
Could you in MiniDSP do 1K5/2K and 2K5 as x/o freq experiments and make off axis measurements until 90 degrees horizontal in 10 degree steps for each of these x/o frequencies?
I would really like to see a comparison of off axis curves for this waveguide/midwoofer combo for different x/o frequencies.
Regards,
Eelco
Hello X, maybe inappropriate but I am still going to try a Special Request:
Could you in MiniDSP do 1K5/2K and 2K5 as x/o freq experiments and make off axis measurements until 90 degrees horizontal in 10 degree steps for each of these x/o frequencies?
I would really like to see a comparison of off axis curves for this waveguide/midwoofer combo for different x/o frequencies.
Regards,
Eelco
I can do this but maybe 15 deg from 0 to 75. Are we talking symmetric LR2 slopes?
Thanks for that - looks like an inherent problem with this driver.
ALL drivers behave this way.
ALL drivers behave this way.
Some more than others. I don't recall seeing this with RS225-8. I also doubt that a SS 18W/8531G has this high of a H3 value.
Just found this on PE's Tech Talk forum.
Rs180p-8 - Techtalk Speaker Building, Audio, Video Discussion Forum

Look familiar?
For comparison, here is my measurement:
I also ran across another RS28F and RS180P-8 project with this XO (both drivers on positive phase):
http://techtalk.parts-express.com/forum/tech-talk-forum/63563-rs180p-8-and-rs28f/page5


Rs180p-8 - Techtalk Speaker Building, Audio, Video Discussion Forum
Look familiar?
For comparison, here is my measurement:
I also ran across another RS28F and RS180P-8 project with this XO (both drivers on positive phase):
http://techtalk.parts-express.com/forum/tech-talk-forum/63563-rs180p-8-and-rs28f/page5
Last edited:
- Status
- This old topic is closed. If you want to reopen this topic, contact a moderator using the "Report Post" button.
- Home
- Loudspeakers
- Multi-Way
- RS28F-RS180P-B80 as Hole Filler 3-way