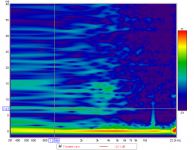
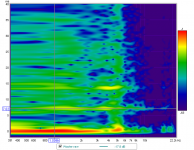
Earl, attached is an amplitude chart of the two digital correction filters used in the two acoustic measurements I took.
So those are not acoustic responses but filter responses? I can't keep track of when you are showing what.
So those are not acoustic responses but filter responses? I can't keep track of when you are showing what.
Those are two linear phase digital FIR *correction* filters generated by the Acourate design software after Acourate analyzes the measured acoustic impulse response of my speaker system. The green curve is with a 15 Hz subsonic digital filter applied.
There is much more to this which is why I linked to two articles that documents the basic and advanced step by step procedures. Reading the articles, one can see how Acourate works.
The linear phase digital FIR correction filter (green curve) is hosted in a software based runtime convolution engine (i.e. JRiver).
To see the acoustic result of the applied digital FIR correction filter, I used REW, with the mic setup at the LP, in which the swept sine wave is convolved in real-time with the linear phase FIR correction filter (the green curve) which yields the attached measured acoustic frequency and impulse responses (the blue curves) of my right speaker. My previous post documents the measurement chain. The REW mdat acoustic measurement file is here.
Reading the linked step by step guides walks through the process of measuring the speakers, designing the digital correction filters, which includes designing a 3 way digital XO, time aligning the drivers, and designing the room correction, generating the digital correction filters, and running a test convolution to see the predicted results. All in the digital domain.
The REW acoustic measure of the right speaker (blue curves), with the digital correction filter (green curve) in the measurement path, confirms the correction filter is working as designed. And working quite well over multiple mic positions as I measured 6 locations covering a 6' x 2' (couch) area - overlay attached.
Following the step by step guides, anyone with the right gear can achieve very similar results to what I have posted. Or see how Acourate works and how I achieved these results.
Attachments
So that is the correction filter applied AFTER the "driver linearization" filters (and xover, of course), or is it showing everything at once?
The correction filter shown contains the 3 way digital XO, time alignment, and room correction. It does not contain the individual driver linearization's yet as I am experimenting with a new HF waveguide.
After individual driver linearization, I am expecting better results like the before and after driver linearization's attached from my advanced Acourate article linked above. Measured at 30cm on axis for each driver, full resolution (no smoothing) response.
After individual driver linearization, I am expecting better results like the before and after driver linearization's attached from my advanced Acourate article linked above. Measured at 30cm on axis for each driver, full resolution (no smoothing) response.
Attachments
Is this room correction with parametric equalization? ... http://www.xtzsound.com/en/products/measurements/room-analyzer-ii-pro
Last edited:
Its hard to argue with Pos post, with one caveat. What happens if there is a HF rolloff, as will always occur in real life? Your top end is a brick wall. That can't happen in reality. And what about a slower -12 dB / oct fall at a higher frequency - more like what I always see.
The brickwall is Nyquist's frequency (44.1kHz sampling rate)
Here is the same simulation with a Q=0.707 2nd order LP filter at 20kHz with a 44.1kHz sampling rate, and then 192kHz sampling rate.
Attachments
Is this room correction with parametric equalization? ... Room Analyzer II Pro
No, this is a measurement software/hardware package.
No, this is a measurement software/hardware package.
Sorry Markus.
and as a final comparison, fullrange vs 4th order at 1kHz vs 4th order at 4kHz
POS
Thank you very much for that very enlightening discussion.
I had not considered the effect of the crossovers group delay on the impulse response. The non-minimum phase aspect of the FIR filters can remove this group delay. I am not sure if that is a good thing or a bad thing or (most likely) not a significant aspect of the problem.
DSP is making many new concepts a reality. It now needs to be sorted out which ones are worth doing.
That's exactly my point - it shouldn't.
Earl,
Simple objective of high fidelity could be described as ability to record a sound with a microphone, then record a spearker's response of recording played back, and have the two recordings match. Degree of correlation is then the fidelity of the system.
It's not a matter of "it shouldn't", but a matter of it won't if behavior of bandwidth involved is not accounted for.
Your theory and practice of information systems needs exercise.
The Scientist and Engineer's Guide to Digital Signal Processing by Steven W. Smith, Ph.D. is an excellent reference, and freely downloadable.
12dB/octave roll off clearly shows a system with two poles.
Seal a driver into a small enclosure and apply DC. The enclosure come to equilibrium pressure greater than outside pressure. If a second dynamic driver is used to measure the step response, you see the measurement transducer come to equilibrium. If receiving transducer is dynamic element, then it goes to zero output. If receiving transducer is condenser, a DC output is seen. Of course this is ideal behavior.
Reference condenser microphones are used as both transmitter and receiver elements in defining absolute response. First principles of physics, principle of reciprocity, and a good deal of math are used in analysis.
Standard measurement microphones with electret capsules are readily calibrated against the reference. All commercially produced elecret capsules have tiny vent to prevent them from having DC offset do to changes in atmospheric pressure and changes in temperature. The really good ones roll off well below 6Hz. Phantom power for these is decoupled with capacitors, adding another layer of low frequency roll off to equation.
All this is readily measured with small closed coupler system.
Multiple measurements with different sized coupler volumes, and substituting multiple output stages and input stages allows determination of real response of all components. This is then combined with free field anechoic measurements to get complete picture.
Simple objective of high fidelity could be described as ability to record a sound with a microphone, then record a spearker's response of recording played back, and have the two recordings match. Degree of correlation is then the fidelity of the system.
No, it's not, and that's what you still don't accept. This could only be true if the receiver (your ear/brain) is a linear time-invariant system. But it is not: it is neither linear (look at Fletcher-Munson and later researches) nor time-invariant. What you hear depends largely on the loudness and on the time the direct sound and it's reflections arrive and the level difference between both events.
Measuring at the listening position the same signal what was fed into the speaker is not totally wrong, but it is far from optimum.
Somehow, as interesting and educational this thread is, I got the feeling we are departing from Markus' main subject of discussion.
But I could be wrong because I'm not in Markus' head.
But I could be wrong because I'm not in Markus' head.
No, it's not, and that's what you still don't accept. This could only be true if the receiver (your ear/brain) is a linear time-invariant system. But it is not: it is neither linear (look at Fletcher-Munson and later researches) nor time-invariant. What you hear depends largely on the loudness and on the time the direct sound and it's reflections arrive and the level difference between both events.
Measuring at the listening position the same signal what was fed into the speaker is not totally wrong, but it is far from optimum.
Human perception is completely separate from sound generation and propagation. Perception is completely based on sound pressure at entrance of ear canals propagating in direction of eardrum.
Microphone is point receiver, speaker is point transmitter, acting only on single signal. Speaker's primary role is continuing sound of direct object of the microphone. Direct sound of speaker is primary focus of listener.
This is readily extended to microphones positioned to capture reverberant field of source located is such an environment. At sufficient distance from source, primary object of microphone becomes reverberant field, with direct sound still captured as first signal that is often weaker than superimposed sum of all reflected signals. This is decomposed as splitting of direct signal into direct part, and reflected part. Captured sound is sum of direct sound with convolution of the IR of reverberant sound for given source and receiver positions. This is basis for reverberation effects based on real spaces.
Linear time invariant behavior of transmission system from source to receiver is dominant feature of audio signal systems. IR of system is convolution of IR response of all elements within complete system.
Choice of listening room is highly variant. For given room with given transmitter and receiver locations this too become highly linear time invariant system. Choice for listener becomes how to modify this response with additional filter system. This filter system in case of PEQ is linear time invariant and is convolved onto signal. Single point inversion of IR for transmitter/receiver pair may be used, but only guarantees source signal reconstruction at receiver point for given transmitter/receiver pairing.
Method of frequency dependent windowing effectively captures direct sound of speaker at higher frequencies, and incorporates room response of speaker as part of the speaker at lower frequencies. This is highly similar to accepting basic response of speaker as correct, and using properly selected PEQ filters for lower frequency room modes as they occur at selected listening position.
I don't get such clean results even when measuring so close. How close was the nearest boundary?
Is 23cm even outside your speaker's near field?
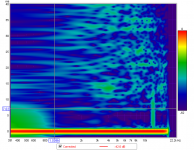
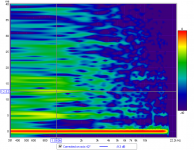
Raw results are not clean. Here are spectrograms, 40ms with 3ms windowing at 9" (23cm) reference to 0dB at 1kHz:
Raw tweeter:

Raw woofer:

Corrected system:

For the corrected system, the temporal contributions are highly matched. Speaker and room are effectively corrected at the measurement point. All primary modes are driven at point of speaker and corrected at point that is fractional wavelength for all frequencies shorter than measurement distance. Thus primary room mode and low order modes are corrected for peaks throughout room.
Measurements are made with microphone about 1m above floor.
Spectrogram of corrected system at 42" on listening axis, my preferred listening distance for these speaker when spaced to be equidistant from side walls and each other, and located in vertical plane about midway between front wall and back wall reveals plenty of expected reflections. Strongest is about -9db, 12ms after direct sound. This is combination of side walls and back wall:

The above picture is quite telling of room power response and decay.
I find this listening setup provides detailed imaging, with recording reverberations dominant over listening room contribution. Sweet spot is quite large. Image depth of good symphonic recordings extends beyond front wall, and individual voices/instruments are resolved to <5 degrees of arc in horizontal plane. Specific recordings typically require small shifts in listening distance to achieve best image focus.
Integration with single sub placed between speakers fills in low end, and reduces IM distortion of speaker's 5.25" woofer.
Since woofer is pointed vertically and mounted in 6" highly damped pipe, there is no baffle step. Forward firing 2" tweeter mounted in 2" pipe crossed steeply (>200dB/oct) presents primary diffraction pattern that is stable throughout sweet spot. Measurement of this tweeter at 9" is effectively at boundary of near field response. Off axis measurements primarily reveal directivity of tweeter, and small variation in diffraction behavior below 4kHz, the upper bound of temporal cues.
Human perception is completely separate from sound generation and propagation. Perception is completely based on sound pressure at entrance of ear canals propagating in direction of eardrum.
And exactly here is the first flaw in your theory: the sound pressure at entrance of the ear canals is not spatially independent. Turn your head a little and it is completely different. Just sit 10 cm to the left and it is completely different.
You can't compare your head with your microphone.
^
Interesting read is Swen Mueller's dissertation (German). They found that equalizing different speakers to have the same ear response made them sound the same. Simple on-axis equalization was NOT enough. Both tests were done in an hemi-anechoic room.
Interesting read is Swen Mueller's dissertation (German). They found that equalizing different speakers to have the same ear response made them sound the same. Simple on-axis equalization was NOT enough. Both tests were done in an hemi-anechoic room.
Last edited:
And exactly here is the first flaw in your theory: the sound pressure at entrance of the ear canals is not spatially independent. Turn your head a little and it is completely different. Just sit 10 cm to the left and it is completely different.
You can't compare your head with your microphone.
It's not my theory, and there isn't a flaw.
Eardrum is small membrane that responds to air pressure variation just as membrane of microphone does.
Linear time invariant system covers all spatial phenomena. What changes with head position changes with microphone position.
It's not my theory, and there isn't a flaw.
Eardrum is small membrane that responds to air pressure variation just as membrane of microphone does.
Linear time invariant system covers all spatial phenomena. What changes with head position changes with microphone position.
The difference is that there's no pinna and no ear canal in front of the microphone. The pinna is a spatial encoder.
- Status
- Not open for further replies.
- Home
- General Interest
- Room Acoustics & Mods
- Room Correction with PEQ


