AX-Deluxe+NS
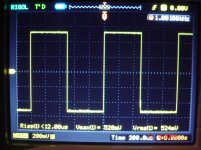
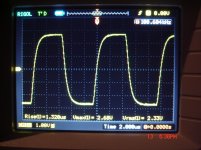
Square Wave Test.
Listening test & FFT test not yet.
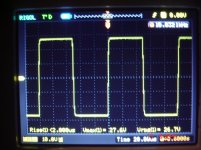
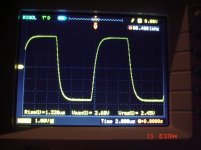
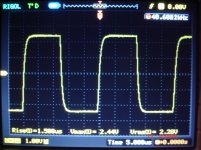
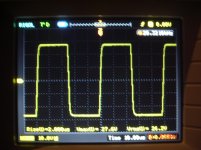
Square Wave Test.
Listening test & FFT test not yet.
Attachments
Last edited:

Looking at your sqwave plots:
I have to ask, do you see any extra information in terms of overshoot, or ringing as you step from 1kHz sqw to 100kHz sqw?
I can't see any thing extra.
The only thing you are achieving is pushing more power into the Output Zobel (making it hotter) and taking the output devices closer to cross conduction.
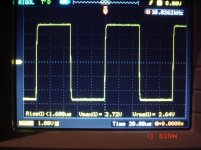
Just test at 1kHz, that gives you all the information you need to see. Expand the horizontal ten times if that facility is available on the digital scope. This will let you see ripple detail, if there is some overshoot/ringing.
I have to ask, do you see any extra information in terms of overshoot, or ringing as you step from 1kHz sqw to 100kHz sqw?
I can't see any thing extra.
The only thing you are achieving is pushing more power into the Output Zobel (making it hotter) and taking the output devices closer to cross conduction.
Just test at 1kHz, that gives you all the information you need to see. Expand the horizontal ten times if that facility is available on the digital scope. This will let you see ripple detail, if there is some overshoot/ringing.
No,i can't see any overshoot not ringing even expanding the horizontal all the way.Looking at your sqwave plots:
I have to ask, do you see any extra information in terms of overshoot, or ringing as you step from 1kHz sqw to 100kHz sqw?
I can't see any thing extra.
The only thing you are achieving is pushing more power into the Output Zobel (making it hotter) and taking the output devices closer to cross conduction.
Just test at 1kHz, that gives you all the information you need to see. Expand the horizontal ten times if that facility is available on the digital scope. This will let you see ripple detail, if there is some overshoot/ringing.
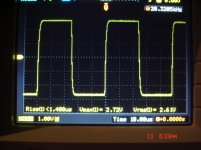
I normally like to do 1KHz and 20KHz.
1KHz gives me a good overall view of the step response.
20KHz can be considered as a "close up" - you see the corners and vertical step curve's angle much better. If it's too "trapezoid" - the amp is relatively "slow".
Some 20Vpp swing is normally more than enough for "express assessment".
1KHz gives me a good overall view of the step response.
20KHz can be considered as a "close up" - you see the corners and vertical step curve's angle much better. If it's too "trapezoid" - the amp is relatively "slow".
Some 20Vpp swing is normally more than enough for "express assessment".
While you're at it let me know what you are missing to build the Simpelstark ODNF amp. It's all through hole. No-global-loop amplification
Ok,ι will include it,While you're at it let me know what you are missing to build the Simpelstark ODNF amp. It's all through hole. No-global-loop amplification
")
Last edited:
Ok Jeff,you will have a mail soon!I think so. Those are the boards I will be sending.
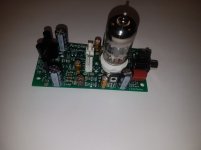
We stay tuned!TubSuMo is ready for testing!
What is the tube type?
Last edited:
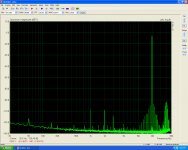
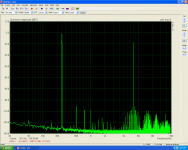
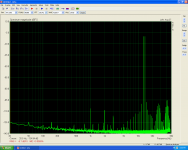
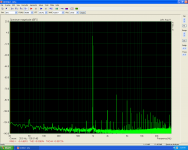
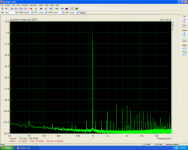
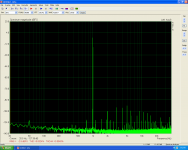
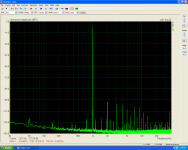
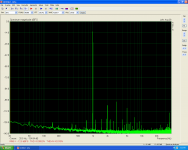
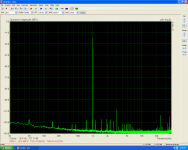
AX-Deluxe FFT Test.
AX-Deluxe FFT using 6R dummy load.
+/-50V
75.000uf/Rail
Idle=7mV/0.22R=31mA
R dummy=6R
AX-Deluxe FFT using 6R dummy load.
+/-50V
75.000uf/Rail
Idle=7mV/0.22R=31mA
R dummy=6R
Attachments
-
 IMD 3 14V.PNG103.9 KB · Views: 73
 -
 IMD 2 14V.PNG103.4 KB · Views: 81
 -
 IMD 12V.PNG110.9 KB · Views: 74
 -
 26.6V 6R.PNG108.1 KB · Views: 84
 -
 21.1V 6R.PNG107.8 KB · Views: 79
 -
 19V 6R.PNG107.5 KB · Views: 241
 -
 14V 6R.PNG107.3 KB · Views: 241
 -
 6V 6R.PNG106.3 KB · Views: 242
 -
 2.5V 6R.PNG106 KB · Views: 253
 -
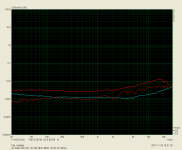 STEPS NEW BIAS 14V.PNG64.9 KB · Views: 77
Last edited:
Hi Thimios, thank you for the spectrums - looking good.
I think overall distortion level may be even lower if you roughly double the bias - as I remember, my optimum value was 62.5mA of idle current per output pair.
It's interesting that distortion level is rather consistent throughout the bandwidth.
Cheers,
Valery
I think overall distortion level may be even lower if you roughly double the bias - as I remember, my optimum value was 62.5mA of idle current per output pair.
It's interesting that distortion level is rather consistent throughout the bandwidth.
Cheers,
Valery
- Home
- Amplifiers
- Solid State
- Revisiting some "old" ideas from 1970's - IPS, OPS