Many thanks for that; I'm still looking around for the how-to on posting photos here ":^)
Here's the Beveridge lens patent, the thing is entirely curves. The abrupt discontinuities I referred to are the entrance and exit.
I clearly must de-stuff the lens channels but I still want to treat the entrance and exit. That's why I asked about the location of foam at such discontinuities.
I do not see any value in foam 'leading the event' in the sound path and intend to add foam only at and after the transition. I'll keep the total down to something I can reasonably EQ out.
Thanks for this conversation, it's fascinating stuff for me.
Attachments
Last edited:
Many thanks for that; I'm still looking around for the how-to on posting photos here ":^)
Here's the Beveridge lens patent, the thing is entirely curves. The abrupt discontinuities I referred to are the entrance and exit.
I clearly must de-stuff the lens channels but I still want to treat the entrance and exit. That's why I asked about the location of foam at such discontinuities.
I do not see any value in foam 'leading the event' in the sound path and intend to add foam only at and after the transition. I'll keep the total down to something I can reasonably EQ out.
Thanks for this conversation, it's fascinating stuff for me.
I would never use the foam inside the Beveridge lens canals. They work like a mix of the channels in a rephasing plug, a compression driver, and a MEH. They are *supporsed* to compress the airflow first (causing some turbulences and reflections, in other words HOMs, but reducing the air to a blade, and this is a desired effect for that type of transducer to work) and then to open up like (ME) horns to cause a wide horizontal dispersion. I would at most put some foam in the front part. If the foam enters the compressing part, then you are attenuating everything because of the way it has been designed – and of course the higher frequencies disproportionately.
Last edited:
Hello All,
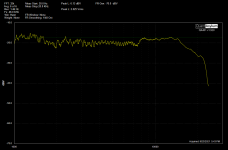
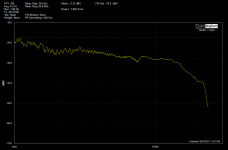
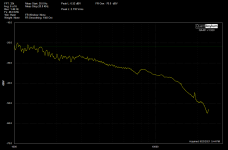
Last winter I gently placed small of fluffed up Dacron pillow stuffing in the port of a test bass reflex speaker in Sparky’s Lab. It was interesting to see the effects to the impedance curve and frequency response. What was not so fun was seeing the ill effects coming out of the port well above the port resonate frequency.
When things cool off this fall/winter I am planning to gently placed amounts of fluffed up Dacron pillow stuffing in a couple of different horns. The plan is to hold the Dacron stuffing stuff in place with fishnet over the mouth of the horn and bits of Velcro outside the mouth of the horn.
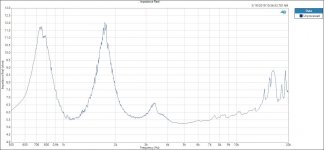
If you have ever plotted the impedance curves of horns/waveguides they have multiple impedance peaks, often 3 impedance peaks. On top of that horn/waveguide impedance curves have ragged saw-tooth edges prominent on the curves. For woofer and mid-range impedance curves if I see edges and bumps I think they are reflections.
Horns are acoustic transformers, the different shapes and curve transitions are what cause the multiple horn/waveguide impedance peaks. I suspect the saw tooth edges on the horn/waveguide impedance curves are caused by reflections along the length of the length of the horn boundaries.
There is a Audio Precision analyzer and a pair of calibrated GRAS microphones ready to go. I will post horn/waveguide plus gently fluffed up Dacron pillow stuffing in the impedance curves and frequency response plots.
Thanks DT
Attached is a previous JBL2432H Compression Driver with a JBL PT 1010HF waveguide attached.
Last winter I gently placed small of fluffed up Dacron pillow stuffing in the port of a test bass reflex speaker in Sparky’s Lab. It was interesting to see the effects to the impedance curve and frequency response. What was not so fun was seeing the ill effects coming out of the port well above the port resonate frequency.
When things cool off this fall/winter I am planning to gently placed amounts of fluffed up Dacron pillow stuffing in a couple of different horns. The plan is to hold the Dacron stuffing stuff in place with fishnet over the mouth of the horn and bits of Velcro outside the mouth of the horn.
If you have ever plotted the impedance curves of horns/waveguides they have multiple impedance peaks, often 3 impedance peaks. On top of that horn/waveguide impedance curves have ragged saw-tooth edges prominent on the curves. For woofer and mid-range impedance curves if I see edges and bumps I think they are reflections.
Horns are acoustic transformers, the different shapes and curve transitions are what cause the multiple horn/waveguide impedance peaks. I suspect the saw tooth edges on the horn/waveguide impedance curves are caused by reflections along the length of the length of the horn boundaries.
There is a Audio Precision analyzer and a pair of calibrated GRAS microphones ready to go. I will post horn/waveguide plus gently fluffed up Dacron pillow stuffing in the impedance curves and frequency response plots.
Thanks DT
Attached is a previous JBL2432H Compression Driver with a JBL PT 1010HF waveguide attached.
Attachments
Last edited:
Horns are acoustic transformers, the different shapes and curve transitions are what cause the multiple horn/waveguide impedance peaks. I suspect the saw tooth edges on the horn/waveguide impedance curves are caused by reflections along the length of the length of the horn boundaries.
First, the three large impedance peaks are the result of driver resonances, not horn resonances. Only wall discontinuities (most notably the mouth) will cause horn reflections and further impedance peaks. A very low diffraction/reflection waveguide will have only two peaks, no others, as mine do.
To me, the rough nature of your impedance indicates a poor measurement and not reality.
I have it on my list of things to do. I have two people who are interested.
I can send blocks of foam that are 12 x 14 x 16. This will make two large plugs and many more smaller ones (assuming efficient cutting.) They will be 100$ each including shipping. Would the two who had asked me about this re-email me with address. Please pay by PayPal, or send me a check. Thanks
Best way to cut the foam is with a hot wire (the fumes are toxic) or an electric knife works well. The foam can be sanded with a low speed, very course (50) sanding disk. Hold the foam and drag it through the spinning disk, not the other way around.
First, the three large impedance peaks are the result of driver resonances, not horn resonances. Only wall discontinuities (most notably the mouth) will cause horn reflections and further impedance peaks. A very low diffraction/reflection waveguide will have only two peaks, no others, as mine do.
To me, the rough nature of your impedance indicates a poor measurement and not reality.
Hello,
I completely disagree with both of your paragraphs.
The first or lower impedance peak is related to the compression driver.
However the higher the higher impedance peaks change completely or even disappear with different horns or waveguides attached to the very same CD.
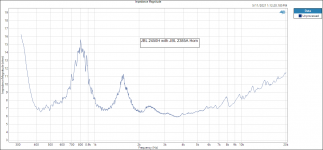
There is no error in the impedance measurements. The measurements are made with an Audio Precision APx555 Analyzer and Audio Precision APx1701 Transducer test interface following AP procedures. Professional gear.
The graphs are from raw data with no smoothing or math adjustments. The saw tooth appearance only appears measuring CD/Horns/waveguides, not with cones or domes. If I turn on the math smoothing the plots do not have the saw tooth appearance.
Please send me the paypal address to send payment.
Thanks DT
Another CD/horn plot
Attachments
All compression drivers have at least two peaks, on any horn. These peaks will move around based on the mass load of the horn. Some compression drivers can have three peaks, on any horn. As I said, mine only has two peaks and makes a very clean impedance without all the hash seen on yours. Trust me (I've done this more than a few times,) something is wrong with your measurements despite using premium equipment.
I completely disagree with both of your paragraphs.
The first or lower impedance peak is related to the compression driver.
However the higher the higher impedance peaks change completely or even disappear with different horns or waveguides attached to the very same CD.
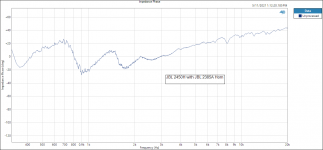
Looking at the JBL impedance plot of a 2445 driver on a 2385A compared to your JBL2450H on the 2385A horn, the peaks on the 2445 appear to be at 450, 900, & 1800Hz, the 2450 at 800,1600 & 2200 Hz.
It appears you may have used a series capacitor in your test, which may affect the impedance peak locations.
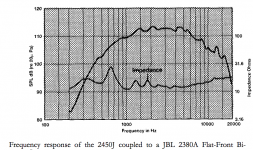
Looking at JBL's 2450J/2380A impedance plot, the peaks are at 650, 1400, and 1800 Hz. Different horn/driver combinations result in different impedance peak locations.
Regarding the "hash" in your impedance measurements, I don't doubt that they are there, the smoothing and shorter vertical scale in the JBL measurement would mask the finer detail apparent in yours.
Attachments
Last edited:
Regarding the "hash" in your impedance measurements, I don't doubt that they are there ...
In all my years of making these kinds of measurements I have never failed to get a perfectly clean electrical impedance. You'd have to explain to me how such a fine "hash" as seen in those plots is possible. What could cause them (besides noise and the like in the data?)
If you did a two channel measurement of the voltage and current then you could look at the coherence to see if the results are valid. Usually I get a 1.0 across the bandwidth, except for a small portion around resonance where the current drops to very low values.
For grins when I first saw the saw teeth in the AP impedance plots I had much the same kind of thoughts.
Thinking noise I repeated the impedance sweep thinking that noise being random would tend to average to lower values. What happened was that the saw teeth appeared over and over again at the same magnitude right on top of each other on an repeated test sweep.
Then I repeated the AP impedance test sweep with everything the same but with a dome tweeter. All the saw teeth disappeared.
Over the years I have repeated similar CD/Horn/waveguides and other types of tweeters, mid-range drivers and woofers. The saw teeth on the AP impedance plots seems to be CD/horn/waveguide related.
Next Time I go to the fabric store I will pick up some fish net and Velcro to try my hand at acoustic damping the mouth and throat of some different CD/horn/waveguide combinations.
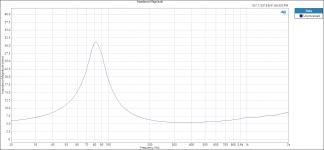
Thake a look at the attached impedance plot of a JBL2118H mid-driver that I like. Note that there are no saw-teeth.
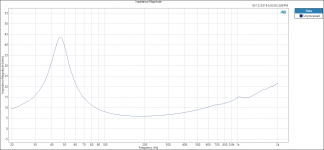
Also see the impedance plot of a JBL2226H woofer. Note that there are no saw-teeth.
Thanks DT
Thinking noise I repeated the impedance sweep thinking that noise being random would tend to average to lower values. What happened was that the saw teeth appeared over and over again at the same magnitude right on top of each other on an repeated test sweep.
Then I repeated the AP impedance test sweep with everything the same but with a dome tweeter. All the saw teeth disappeared.
Over the years I have repeated similar CD/Horn/waveguides and other types of tweeters, mid-range drivers and woofers. The saw teeth on the AP impedance plots seems to be CD/horn/waveguide related.
Next Time I go to the fabric store I will pick up some fish net and Velcro to try my hand at acoustic damping the mouth and throat of some different CD/horn/waveguide combinations.
Thake a look at the attached impedance plot of a JBL2118H mid-driver that I like. Note that there are no saw-teeth.
Also see the impedance plot of a JBL2226H woofer. Note that there are no saw-teeth.
Thanks DT
Attachments
Earl,In all my years of making these kinds of measurements I have never failed to get a perfectly clean electrical impedance. You'd have to explain to me how such a fine "hash" as seen in those plots is possible. What could cause them (besides noise and the like in the data?)
Having made few impedance measurements, but having looked at plenty, the "rough nature" , "hash" or "saw-teeth" in DualTriode's measurements simply look as if they have more data points and less smoothing than JBL's.
The magnitude of the ripples are small compared to the impedance peaks and dips, which are similar in overall amplitude to JBL's charts.
As you wrote previously "A very low diffraction/reflection waveguide will have only two peaks, no others, as mine do".
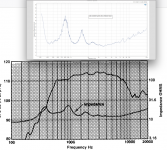
The JBL 2385 or 2380 horns exhibit several impedance peak/dips regardless of the driver used, though the 2450 driver has more than the 2445.
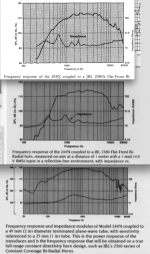
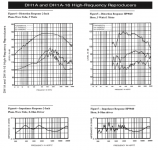
The EV DH1A on a HP9040 horn, which has even more "pinches" and transitions than the JBL 2385 or 2380 horns shows a far more ragged impedance response, though I suspect EV also used less smoothing or more data points than the JBL images.
Would you anticipate 30PPI reticulated open cell PU foam would reduce the impedance peaks/dips in those diffraction horns?
Art
Attachments
Last edited:
For grins when I first saw the saw teeth in the AP impedance plots I had much the same kind of thoughts.
It appears then that this singular driver has this issue. Could the driver be faulty. A loose pebble in the gap would do something like that. From the spacing of the peaks, whatever it is is very very close to the diaphragm - as a cepstrum plot would certainly show.
Earl,
Would you anticipate 30PPI reticulated open cell PU foam would reduce the impedance peaks/dips in those diffraction horns?
Art
It might have a small effect, but probably nothing major. 30 PPI is very open and not a very heavy damping. I see little or no effect on the input impedance from its use. Best is to get rid of the diffraction issues.
Not doubting that junk in the gap or anything contacting the diaphragm could cause the ripples, but both his 2432 and 2450 drivers have similar fluctuations.It appears then that this singular driver has this issue. Could the driver be faulty. A loose pebble in the gap would do something like that. From the spacing of the peaks, whatever it is is very very close to the diaphragm - as a cepstrum plot would certainly show.
If the impedance ripples were caused by particulate, a sine wave sweep would sound very buzzy- wouldn't need a cepstrum plot to hear that
")
Art
I didn't realize that two drivers on this horn yielded the same problem. That is curiuos, unless the horn had a crack in it. That might do something like that.
My only point is that I never ever have trouble with electrical impedance measurements. They are always clean. I can't say exactly just what this is, but it just doesn't seem right to me. Especially because of how close together they are. If the AP does coherence then I would certainly check that.
- Home
- Loudspeakers
- Multi-Way
- Question for Dr. Geddes about his WG foam plug