Its all about the windowing. if everything is synchronous and starts and stops at a zero crossing you can use no window. In reality you do need windowing. How the window deals with the beginning and end of the sample has a lot to do with the information in the translation. Clean waves can be processed with different windows or no window if the start and stop are on the mark. If you are looking and a mix of stuff then windowing is critical and different window functions can highlight different aspects of the signals.
In the real world neither the source nor the sampling system are free of jitter or drift so everything will move inside the bins. In the high resolution measurements I'm making a small amount of drift during the measurement can completely remove a signal.
This is a theoretical question not a practical one. If the cycle begins and ends at the same does it mater if it's zero?
Ummm... the notch needs to be *after* the amp, so that the only thing going to the distortion analyzer *is* the distortion! If you don't put the fundamental into the amp, it won't make any distortion!
Doah! I was in a rush to get some images for Sync. Sync, sorry about that. Here is an image with the notch after the amp as it should be. Let me know what you all think. Notch is set for -60dB:

Bear, yeah, that was only one small corner of my bench. The rest is a mess, but I did not include that in the photo!
Everyone have a good evening.
I did not take reference to the values; I was using the spectrum image as a go / no go. I use the export feature of ARTA to export measured values in CSV format. Then open in Excel and document (I wish ARTA put harmonic markers on the screen with values like other software). The problem with CSV values is it gives you 4000 lines. Each frequency of your spectrum is documented. When I have more time, I will get to export and put something together to show values.
Thanks Jan! I may take you up on that in the future. I use XY graphs in Excel for most of my distortion, frequency, other plots. 4000+ points in an small size XY graph looks like a Rorschach test!
I appreciate your offer and will contact you once I have something worth plotting.
Have a good one!
Dave
I appreciate your offer and will contact you once I have something worth plotting.
Have a good one!
Dave
Well, I mention this because the value of the 2nd Harmonic seems similar to the original reading, which after the application of the notch one would think would be A) different "real" or measured value and B) look different on the display, as would the rest of the spectrum look cleaner and (guessing) would be displayed as a higher level on the screen??
Although perhaps I don't quite follow how the notch filter is going to work in practice...
Although perhaps I don't quite follow how the notch filter is going to work in practice...
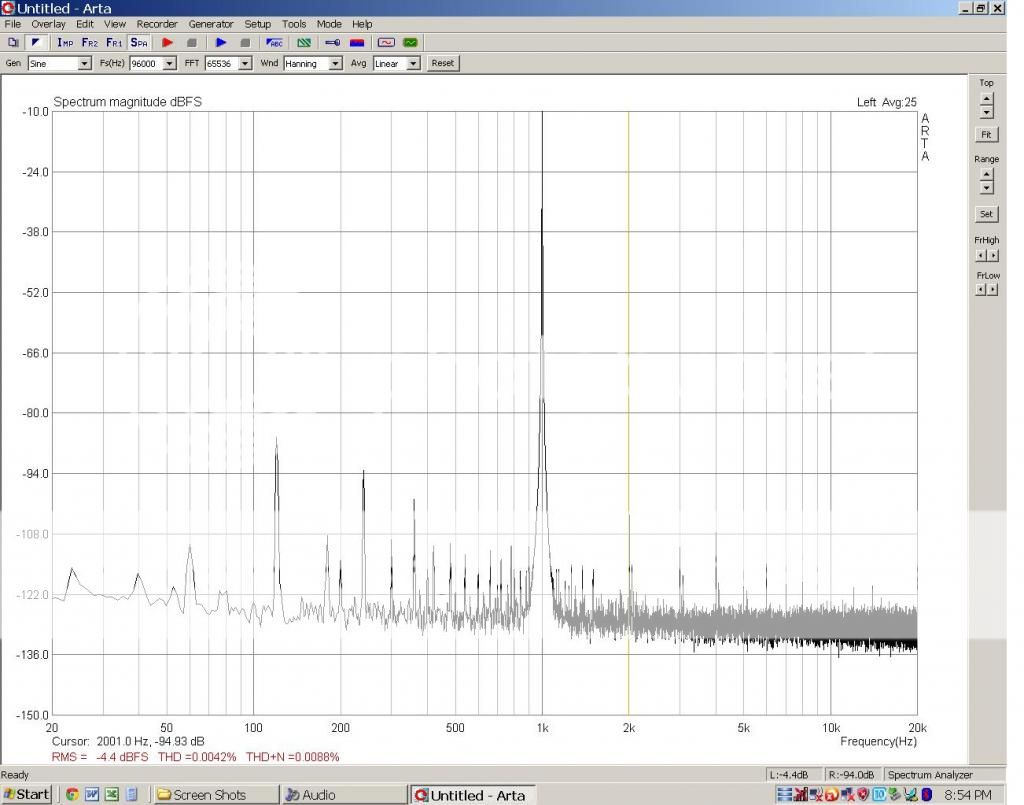
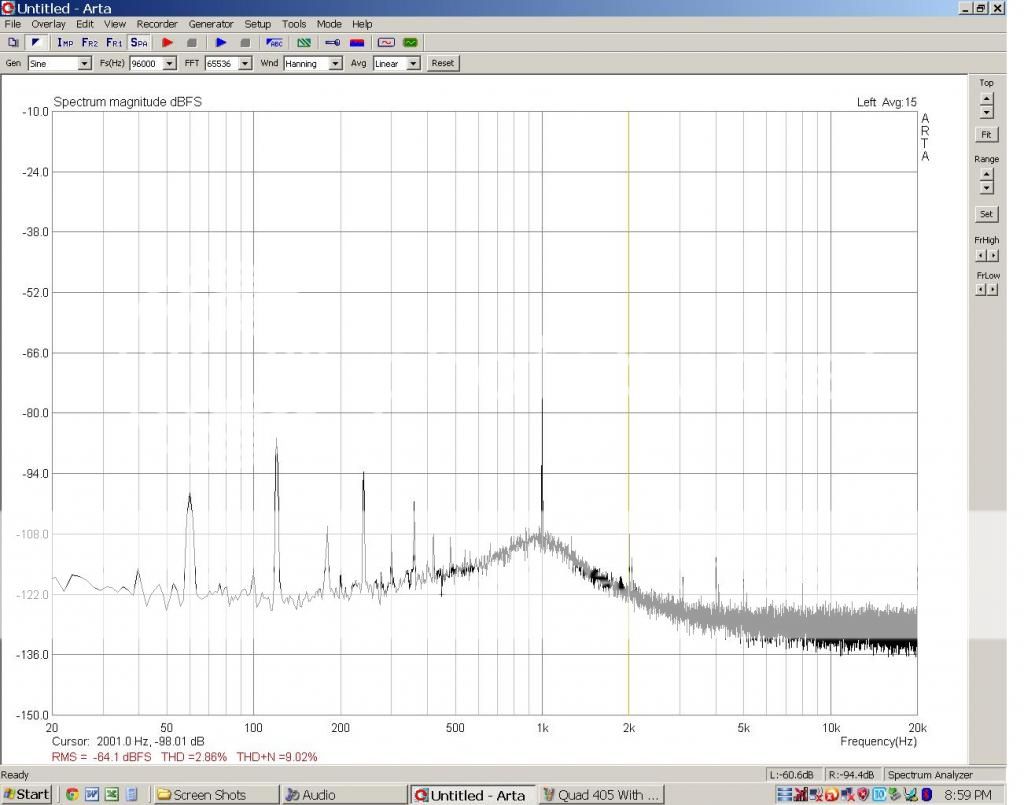
I took some time and setup everything one last time with good cable management and captured the following images. Bear, I also have the 2nd, 3rd, 4th and 5th harmonic values. They do improve a bit with the notch active and the THD and THD+N values show this (on the notch image). I'm not the expert, but it looks like ARTA does a good job of taking the fundamental into account for it's calculation of THD (with or without notch).
As a side note; I have compared the ARTA THD+N value with my HP 8903 and the two are just about equal. I use the 30KHz filter on the 8903. This provides some confidence when using the whole soundcard setup") .
.
I'm not sure how this will format for the post, but here are the measured values:
Without Notch With 60dB Notch
THD .0042% THD 2.86%
THD+N .0088% THD+N 9.02%
2nd -95dB 2nd -98dB
3rd -111dB 3rd -120dB
4th -107dB 4th -113dB
5th -120dB 5th -120dB
It looks like I pickup a very small amount of noise with the notch in circuit, but THD does drop.
Without Notch:
With Notch:
Overall I am happy with my results.
As a side note; I have compared the ARTA THD+N value with my HP 8903 and the two are just about equal. I use the 30KHz filter on the 8903. This provides some confidence when using the whole soundcard setup
.I'm not sure how this will format for the post, but here are the measured values:
Without Notch With 60dB Notch
THD .0042% THD 2.86%
THD+N .0088% THD+N 9.02%
2nd -95dB 2nd -98dB
3rd -111dB 3rd -120dB
4th -107dB 4th -113dB
5th -120dB 5th -120dB
It looks like I pickup a very small amount of noise with the notch in circuit, but THD does drop.
Without Notch:

With Notch:

Overall I am happy with my results.
I always find it helpful to do two things with ARTA: 1) use a scaling that has 10dB major div's; 2) Adjust the notch for exactly 40dB or 60dB of attenuation -- then just divide ARTA's calculated values by 100 or 1000 to get the real result. Just a convenience for plot reading, but it sure cuts down on confusion.
I just posted an update on my efforts with JensH notch filter here: http://www.diyaudio.com/forums/equi...ilter-distortion-analysis-23.html#post4012316 I'm dealing with the same scaling issues.
using the notch response curve that skidave showed, if the cursor was moved to f2, f3, etc and the values noted, that would give you the corrections to be added to displayed values on the notched fft.
Using the -40 or -60 db notches as Dick suggested is a great idea to be able to calculate on the fly.
100% = same value = -Odb
10% = 0.1 of value = 20 log (10/100) which is -20 db
1% = 0.01 of value = 20 log (1/100) which is -40 db
.1% = .001 of value = 20 log (.1/100) which is -60 db
etc
note the first column is your distortion in %
that is the cheat sheet
Alan
Last edited:
Little help needed.
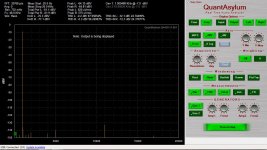
Hello! I bought one of the QA400's last winter. Finally getting around to playing with it. Someone here posted a diagram to build a very simple attenuator so I could hook up the output of tube amps to the unit. I just recapped and restored a Dynaco ST70. I am attaching a screen shot of the output. Does this look right? I am wondering if I need to tweek the settings on the software? I have to admit this is a big learning curve for me. Just trying to take some simple distortion measurements of old audio gear I restore. Any direction greatly appreciated! Robert
Hello! I bought one of the QA400's last winter. Finally getting around to playing with it. Someone here posted a diagram to build a very simple attenuator so I could hook up the output of tube amps to the unit. I just recapped and restored a Dynaco ST70. I am attaching a screen shot of the output. Does this look right? I am wondering if I need to tweek the settings on the software? I have to admit this is a big learning curve for me. Just trying to take some simple distortion measurements of old audio gear I restore. Any direction greatly appreciated! Robert
Attachments
- Home
- Design & Build
- Equipment & Tools
- QuantAsylum QA400 and QA401