Ok I got it, here is the area of each section and the gap width of each section as well. Starting with the speaker placement working our way toward the vent.
section - area - gap
1 - 124.31 - 4.86 inches
2 - 66.75 - 3.71
3 - 10.84 - 3.01
4 - 20.75 - 7.08
5 - 18.93 - 3.50
6 - 38.98 - 4.97
7 - 25.67 - 5.92
8 - 152.04 - 7.13
9 - 101.88 - 7.01
cubic ft behind the driver - 1.115
section - area - gap
1 - 124.31 - 4.86 inches
2 - 66.75 - 3.71
3 - 10.84 - 3.01
4 - 20.75 - 7.08
5 - 18.93 - 3.50
6 - 38.98 - 4.97
7 - 25.67 - 5.92
8 - 152.04 - 7.13
9 - 101.88 - 7.01
cubic ft behind the driver - 1.115
Last edited:
Well... sorry, but I don't think that's what I asked for. You have 3 columns there, section, area and gap. Section obviously refers to the 9 red lines I drew, but I suspect you are still thinking in terms of area between the lines rather than cross sectional area of the line at a certain point. Area refers to ? I have no idea. Gap seems to mean the distance between the 2 panels that form the "port" at each location.
What I needed to see was cross sectional area at each red line (NOT area of the segment), in other words "gap" x enclosure height, which I believe you mentioned was 15.5. So, for example, red line 3 would be 3.01 x 15.5. In effect, now that you've given me "gap" distance, it would be easy enough to multiply each "gap" by 15.5 to get the cross sectional areas I need.
BUT... the reason I asked for csa at 9 different points in the line was to confirm what I suspected. Based on the "gap" measurements, it would appear that the port path is constantly changing, getting bigger, then smaller, then bigger, then smaller, etc. Even in the last couple of segments where it looks straight or uniformly expanding. Unfortunately, to get a really accurate model of something like that is going to require something a bit more detail oriented, like MJK's TL sections worksheet, or Akabak, neither of which I am comfortable with yet.
If I absolutely had to break this down to fit into Hornresp, I'd calculate the volume of everything up to the third red line I drew as the back chamber. The 3rd red line would be the throat, and from there, it still won't break down perfectly into 4 sections, but at least it's a workable solution.
Anyway, the point is that you've made yourself a very complicated shape that is constantly expanding and contracting and it's not easy to get a really accurate model of that. Perhaps someone with MJK's TL sections worksheet can take it from here but it's beyond me now. The inaccuracy of trying to shove this to fit into Hornresp would just add fuel to the fire.
Last edited:
MJK's software is $25 and can be found at quarter-wave.com.
Just so you know, MJK's software - especially the sheet in question - is a bit tougher to figure out than WinISD. You are going to need to lay out about 15 sections to model this properly. It isn't going to be easy to model this for the first time user. I have this software but I've never used the TL sections sheet yet, I'm still working my way through the less complex sheets.
Not really. "Gap" x internal height (15.5 inches) = cross sectional area at any given point. The only thing missing is the length between these points (length of each segment). That's easy enough to figure out. The problem is that this box requires a complex simulation due to the complexity of the port path. Hornresp only allows for 4 segments, so as I mentioned, Hornresp can be used to get a ballpark idea but that's about it.
Just so you know, MJK's software - especially the sheet in question - is a bit tougher to figure out than WinISD. You are going to need to lay out about 15 sections to model this properly. It isn't going to be easy to model this for the first time user. I have this software but I've never used the TL sections sheet yet, I'm still working my way through the less complex sheets.
If I unravel this in Sketchup will it help?
Not really. "Gap" x internal height (15.5 inches) = cross sectional area at any given point. The only thing missing is the length between these points (length of each segment). That's easy enough to figure out. The problem is that this box requires a complex simulation due to the complexity of the port path. Hornresp only allows for 4 segments, so as I mentioned, Hornresp can be used to get a ballpark idea but that's about it.
To simulate this with hornresp, you need following values: The Drivers TS specs, the volume of the chamber behind the driver, the length of the duct, the starting area of the duct and the ending area of the duct. Then you model it as a rearloaded horn and sum the driver and duct outputs.
that doesnt matter in the frequencies we are interested in. as long as the length and volume of the duct are in the ballpark, you will get satisfying results. thats simply because with frequencies so low, they are too large to mind some small changes is area. if you are interested in high frequency response, thats a different matter of course. but who would use this duct as a midrange speaker?
Hi, FYI,
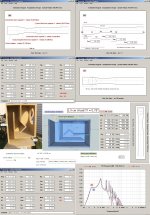
Posting a better picture than in post# 22 that like the former will give superior results if used in MJK: s TL section program, if compared to an oversimplified HR model.
If better resolution is needed, CSA: s and section lengths can be expanded to the limit of what MathCAD can handle (Thousands).
Obviously no lumped compliance volumes are needed for airways calculations as allowed under laying position-descriptions of lengths and areas are of more importance for accurate result when dealing with randomly wiggling of the unknown (no sense) free style tapering like the design shown in post #1.
Floor and at least one wall interaction use actually the as built speaker dimensions and the baffle step and diffraction to sum up, IMO, an unsurpassed overall picture of the speaker performance as seen in the simulated results.
If you want to see an example of MJK: s TL sections program in use, look here:
http://www.diyaudio.com/forums/multi-way/108336-transmission-line-question.html
Especially the posted sequences of pictures at: http://www.diyaudio.com/forums/multi-way/108336-transmission-line-question-3.html#post1447764
b
Attachments
I've made an initial Akabak model. Some of the required dimensions were missing, so I made a scale drawing and managed to come up with some plausible values. The driver parameters provided by AudioQue were missing some useful values - for example, SVC or DVC? VC resistance? Linear Xmax? The values they did provide, and the values they did not, add up to a picture of a driver designed to impress customers who mainly care how much it bumps.
I'm not going to publish graphs until, at minimum, the SVC / DVC and voice coil resistance are known. While waiting, I'll see if a more conventional box in a similar size or smaller will outperform it.
As for why it appears to sound loud, it has a 12 dB peak at 85 Hz which will give a spurious impression of loudness. But it's also dead by 100 Hz, so your bass-mids had better reach down to there to take over. In short, it's a bit of a one-note wonder.
Here's a hint for supplying dimensions:
Try to draw the box plan, using your measurements, life size on a large piece of paper. Lay the result over your box. If it doesn't match, you've made a mistake or not taken enough measurements.
In other words, if you can't clone your box from a sketch and a list of measurements, you can't simulate it in a speaker design program either.
Here's an initial Hornresp export. It produces results similar to the Akabak results.
If you have a recent version of Hornresp, you can paste the parameters into a text file and import into Hornresp directly. Otherwise you'll need to key in the values from the list.
Ver=23.40
Ang=2.0 x Pi
Eg=60.00
Rg=0.00
Fta=0.54
S1=886.00
S2=299.00
Con=38.00
F12=0.00
S2=299.00
S3=350.00
Con=44.00
F23=0.00
S3=350.00
S4=600.00
Con=22.00
F34=0.00
S4=600.00
S5=700.00
Con=118.00
F45=0.00
Sd=890.00
Bl=22.39
Cms=6.26E-04
Rms=0.90
Mmd=253.60
Le=0.75
Re=3.60
Nd=1
Vrc=0.00
Lrc=0.00
Ap=0.00
Lpt=0.00
Vtc=37170.00
Atc=885.00
Com=Bias The Gate
...The values they did provide, and the values they did not, add up to a picture of a driver designed to impress customers who mainly care how much it bumps...
Hi Don,
Agree...
...I'm not going to publish graphs until, at minimum, the SVC / DVC and voice coil resistance are known...
Why not calculate the missing parameter Re from the already given data?
This has been done in the submitted picture at posting # 22 but forget x-max, just use 1W input/ 4 Ohm get a plot enough for SQ examinations.
For SQ reason use about 12 mm at max or use the advertised 38.0mm: one-way that is = 0.1 mm below possible coil bottoming but within guaranteed severe dynamic compression range.
The latter numbers would surely satisfy the more SPL hungry guys residing here at diyAudio.
...In other words, if you can't clone your box from a sketch and a list of measurements, you can't simulate it in a speaker design program either.
I like to read that

b
Here's an initial Hornresp export. It produces results similar to the Akabak results.
If you have a recent version of Hornresp, you can paste the parameters into a text file and import into Hornresp directly. Otherwise you'll need to key in the values from the list.
Ver=23.40
Ang=2.0 x Pi
Eg=60.00
Rg=0.00
Fta=0.54
S1=886.00
S2=299.00
Con=38.00
F12=0.00
S2=299.00
S3=350.00
Con=44.00
F23=0.00
S3=350.00
S4=600.00
Con=22.00
F34=0.00
S4=600.00
S5=700.00
Con=118.00
F45=0.00
Sd=890.00
Bl=22.39
Cms=6.26E-04
Rms=0.90
Mmd=253.60
Le=0.75
Re=3.60
Nd=1
Vrc=0.00
Lrc=0.00
Ap=0.00
Lpt=0.00
Vtc=37170.00
Atc=885.00
Com=Bias The Gate
Hi Don,
Your listed Rms value is not what should be expected, i.e. about 10 times too small.
Tip: Double click the Sd parameter to see the fundamental T/S.
b
Maybe I missed an order of magnitude for Cms. I'll take a look when I'm sober (Xmas season, many Xmas parties and alcohol fuelled lunches).
I guessed 3.6 ohms Re. According to Akabak, Xmax is less than 12 mm at 60 V input.
This agrees with my opinion, that modern audio drivers at the lower end of the market are designed to be "idiiot proof". That is, in a recommended enclosure, at the maximum specified power input, they will not exceed xmech and thus not destroy themselves.
So if you make a warranty claim, they examine the driver. Mechanical damage due to over excursion = you used a non recommended box, no claim. If the voice coil is burnt = you used too much power, no claim.
Exactly
Even the higher-end SPL drivers can have a significant idiot factor built in, to handle people who think they need 5kW for everyday listening.
Hi,
FYI, I tested Dons HR layout (FR not close to the reality, but maybe the LF cutoff looks plausible) using my calculated T/S parameters and noticed that driver offset was not correct.
Even if faking to an estimated 21 cm the plots are far from what MJK: s program would calculate, no reliable conclusions can be drawn from the HR model shown here or from my just posted ones. See the pictures.
The peak shown at 80 Hz is probably not a feature of this design, but who knows?
IME, only a seriously detailed mapped model of the airways would give a hint of the FR.
I know its possible with MJK: s TL offset program or by seriously using the AKAbak or other reliable acoustic simulators.
 It’s time to drop this thread into the trash bin unless proper airways mappings are available.
b
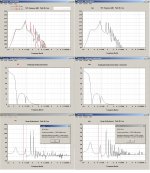
FYI, I tested Dons HR layout (FR not close to the reality, but maybe the LF cutoff looks plausible) using my calculated T/S parameters and noticed that driver offset was not correct.
Even if faking to an estimated 21 cm the plots are far from what MJK: s program would calculate, no reliable conclusions can be drawn from the HR model shown here or from my just posted ones. See the pictures.
The peak shown at 80 Hz is probably not a feature of this design, but who knows?
IME, only a seriously detailed mapped model of the airways would give a hint of the FR.
I know its possible with MJK: s TL offset program or by seriously using the AKAbak or other reliable acoustic simulators.
It’s time to drop this thread into the trash bin unless proper airways mappings are available.b
Attachments
Based on that graph, 80hz peak is perfect for car audio if you use a 80hz low pass filter. The box sounds good to him because the vehicle's transfer function blends in with the 80hz peak.The peak shown at 80 Hz is probably not a feature of this design, but who knows?
http://salupa.exe.ee/muu/1500gtiom.pdf
"Vehicle Acoustics
The acoustics of your vehicle also influence
bass performance tremendously. Fortunately, the
small interior volume of most cars and trucks
boosts low bass output enough to allow for smaller
enclosure sizes while still achieving good bass
performance. As a general rule, below 50-80 Hz
(depending on interior size), bass response
increases at a rate which approaches 12dB per
octave as the frequency decreases. This adds a
significant bass reinforcement to the actual output
of the subwoofer. If this rise in bass is not
addressed in the design of your enclosure, bass
performance may be boosted to the point where it
is actually too strong for some tastes. For others,
there is never too much! The enclosure design
recommendations which appear on the specification sheet for your particular model, were
chosen for optimum in-car performance.
You may find them to be different than the
recommendations from formulas used to
design enclosures for in-home or professional
sound-reinforcement applications.
These “Transfer Function Compensated”
tuning recommendations result in small
enclosures with excellent in-car low frequency
performance."
Hi,
b
It was time to drop this thread as soon as a guy asked for "HELP" over a box he's happy with and unwilling to do any effort on. What a waste of bandwidth.
FYI, I tested Dons HR layout (FR not close to the reality, but maybe the LF cutoff looks plausible) using my calculated T/S parameters and noticed that driver offset was not correct.
Er... you appear to have forgotten to select "Combined Response". Your plots only show the horn mouth SPL response. Add the driver output and you'll see something seriously different.
IME, only a seriously detailed mapped model of the airways would give a hint of the FR.
I know its possible with MJK: s TL offset program or by seriously using the AKAbak or other reliable acoustic simulators.
My Akabak model has 12 segments, with the driver attached at the correct location. It agrees closely with the simplified Hornresp model up to 200 Hz or so. Since this is almost certainly above the sub LP filter cutoff, any higher frequency differences are irrelevant.
- Status
- This old topic is closed. If you want to reopen this topic, contact a moderator using the "Report Post" button.
- Home
- Loudspeakers
- Subwoofers
- Please help! How is this SOOO loud and low?