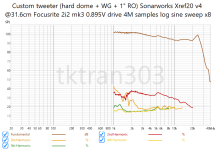
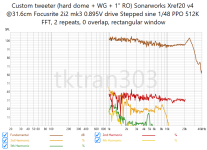
Are these Matlab routines without error now? At my time at University that was not the case ...I tried the method I described in the "Measurement mics" thread in real life.
The results:
1. Old method, as per Matlab 2019b release of non-literal implementation of A.Farina 2007. Sine sweep turned out to be a "Log Chirp" from pre-historic era. Deemp of -3dB/octave is due to log sweep.
Frequency response is wrong here? Only the de-emphasing? Sorry but it's hard to compare measurements when they are obviously different ...2. New method, without noise RIR reduction. No deemp. Quite a difference on low frequencies.
View attachment 1289593
(Never do this in a meeting with group leaders or R&D leaders. These are often pretty intelligent people, detect such flows on the go and will immediatly throw back your results)
But a great example of better analysis giving significant better S/N at low frequencies!
First and most important - I need a logarithmic frequency response! You quickly see when someones background is not Audio when they show a linear frequency axis3. Here I run into a problem with the denoising of harmonic responses: I do not know what is important and what is not.
Let's look at the Spk+Room main RIR spectrogram: You can not see the 2kHz 2nd harmonic presence in the RIR spectrogram. You won't see anything on the 3D waterfall either.
View attachment 1289594
Now, let's look at the 2nd harmonic IR spectrogram: You can clearly see the long decaying tail on 4kHz. That means this driver rings on 2kHz with distortions for quite a long time.
View attachment 1289595
Let's look at the 3rtd harmonic IR spectrogram. It is clear that the distortions do not follow exactly Xms after the main ridge, there is a blip delay at 7.5 kHz.
I am not sure if looking at further harmonics, like 4th, would be interesting for anyone except stubborn perfectionists:
As "Standard" subband denoising like EM-84 could throw away the details that may be important, I would like to ask for opinions on what information you would like to see, and what can be scrapped as noise.
When your noise reduction has (significant) influence to the harmonic ... you have a picture, not a measurement. These graphs are very hard to judge (I only use them for vibratoin measurements if needed). What when you make improvements to your speaker and distortion is reduced 15% ... no way you can see it here.
Sorry to spread bad vibes here ... but these are points which need improvement when you want to design/develop better measurements for audio devices! And we all could need them!
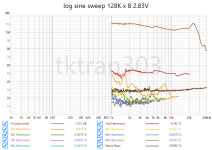
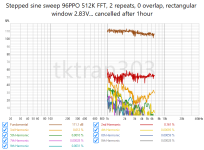
Looks like REW doesn't benefit from longer sequence length after some point. But averaging works perfectly and does what it should.That’s not what my preliminary data shows…
View attachment 1290055
View attachment 1290054
View attachment 1290056
View attachment 1290057
View attachment 1290058
View attachment 1290059
View attachment 1290060
View attachment 1290061
View attachment 1290062
Let me know what you think.
You also see that higher measurement signals gives improved S/N.
It yould be helpful to have the same y-axis at all your measurements you compare! (e.g. 10-120dBSpl) I was wondering why noise floor went down at your higher level measurements ... it doesn't, scale changes ...
Your sweep question got answered 2-3 times - is there anything open to talk about?
Stepped level sweep.
Yes, ok, but, where is the "sweep" ?Stepped level sweep. An old but standard measurement signal and analysis. 31 dedicated sine frequencies and you measure the level.
;-) I would also like to add that.Sorry to spread bad vibes here
By the way:
I think it is urgently necessary to relate the "log sine (Farina)" distortion measurements to "stepped sine e.g. (STEPS (ARTA))" measurements.
Hi Hörnli,
I did address that. In the "old days" when I was starting, the sweep was analogue. We swept the frequency up by hand at first. Then we had voltage controlled oscillators that could sweep with a sawtooth wave (linear sweep scale) or log sweep (log scale). These were both continuous sweeps.
Today with digital sources we step the frequency in discrete steps. Maybe today we could synth a continuous (not really, but it would appear to be continuous) sweep. But for all intents and purposes, the stepped "sweeps" we use today amount to the same thing. We can reduce the step size much like you would with sample rate. However, this is not necessary if your step size is small enough.
So for all practical purposes, it doesn't matter if the sweep is analogue or stepped the way industry commonly does things. It is pointless to argue on theoretical grounds if you compare the results to real world, applied results. So if you are simply looking for an explanation, there you go. Both methods explained from a guy who did it all three ways. Of course there is a fourth. We set a frequency by hand and recorded the number, then the next. I did it that way too. We also had an instrument that had a variable capacitor driven by a motor to vary frequency in a sweep. Cool instrument, did it that way as well.
So there you have the entire history of sweep type measurements and I had to use each method as instrumentation progressed. The differences between the methods as time progressed saved time and gave more accurate readings.
I believe that MLS typically uses Hadamard Transform implemented as Fast Hadamard Transform.MLS needs FFT to get to your data.
So I was confused by your earlier post, and why you say it needs FFT.
Probably just nomenclature issue, the Hadamard Transform is similar to a Fourier Transform, you name them the same?
Best wishes
David
Last edited:
Not only "could" we but, if I understand correctly, that's how it's practically always done....Maybe today we could synth a continuous (not really, but it would appear to be continuous) sweep...
Best wishes
David.
Hi David,
Digital control takes discrete steps, make them fine enough and they would appear continuous. As I was trying to say, it's all the same in a practical sense. It's the same for music from digital files. The resulting output is analogue, but only after smoothing. Even if you generated a ramp for a VCO, the control voltage could be smoothed, but it would not make any difference.
Anyway, this is a complete non-issue. When I do "sweeps" on electronic equipment, be it audio or an RF "sweep", the method is identical. The frequency is generated digitally at individual points, and readings are taken at those points. Even if you did a true analogue sweep, the readings are taken at points, and you may run into errors doing that.
-Chris
It should be named "stepped frequency sweep" but you simply measure the level on the input - without any filter. Similar to what ancient analog tech was doing.Yes, ok, but, where is the "sweep" ?
But you change the frequency - and that's the sweep. It's measuring at different frequencies. There are some different forms of "sweeps", you can also raise the level at 1kHz (level sweep), make a sweep in a sweep (e.g. frequency responses at different level - nested sweep), make it continuous (that's possible also in digital domain! Special name "chirp" sometimes) or stepped. Linear or Log. And I'm sure I missed a few.
As soon as you do an automated measurement from value A to value B it's called a "sweep".
You describe a stepped frequency sweep. That's not what modern programms use - they use a real continuous sweep!The frequency is generated digitally at individual points, and readings are taken at those points.
To be honest I forgot the formulars, we had to program that in Matlab loooong time ago ... but you really output a continuous and logarithmic changing log sweep, no discrete steps.
As far as I remeber the Hadamard Transformation is a quick and efficient way to do the correlation for the MLS and you will get the impulse response of your linear time invariant system. But you need further calculations (FFT/iFFT) for frequency and phase response or to convert between them.I believe that MLS typically uses Hadamard Transform implemented as Fast Hadamard Transform.
So I was confused by your earlier post, and why you say it needs FFT.
Probably just nomenclature issue, the Hadamard Transform is similar to a Fourier Transform, you name them the same?
But to be honest I think it's to complicated and not the point of this thread to get into the math of measurement algorithms here.
I wanted to demonstrate with a few easy graphs that there are BIG differences in S/N of your system depending of the measurement algorithm you use!
How is the equivalent of STEPS (ARTA) called in REW?But to be honest I think it's to complicated and not the point of this thread to get into the math of measurement algorithms here.
Hi IamJF,
It doesn't matter how they accomplish it. You wouldn't hear individual steps because the step values are so small. How it's done depends entirely on the test equipment used or the program itself. I doubt one is any better than the other. So at the moment we're talking about minor things that really do not matter today. A stepped frequency would probably be more accurate at each frequency point - depending.
Having synced analogue sweep with a horizontal display was a memorable method, but the horizontal position never was extremely accurate. They used a tuning cap being rotated slowly via a motor. The vanes were never 100% "linear" vs rotation angle. But, it was more than good enough at the time. Even a VCO may not be as accurate as people might expect. Digitally done? Depends a great deal on hardware and the firmware / software. Nothing is perfect. Not unless you get into the silly expensive test gear anyway. But for our purposes, it is more than close enough.
Then of course, everything shifts with temperature, humidity and air density if you are looking closely enough.
I did exactly. I guess some may calculate the DAC values for a real sweep and send that to the DAC, a lot of work for nothing and you couldn't tell from observation. You would need to capture and process that output to determine what they did exactly.You describe a stepped frequency sweep.
It doesn't matter how they accomplish it. You wouldn't hear individual steps because the step values are so small. How it's done depends entirely on the test equipment used or the program itself. I doubt one is any better than the other. So at the moment we're talking about minor things that really do not matter today. A stepped frequency would probably be more accurate at each frequency point - depending.
Having synced analogue sweep with a horizontal display was a memorable method, but the horizontal position never was extremely accurate. They used a tuning cap being rotated slowly via a motor. The vanes were never 100% "linear" vs rotation angle. But, it was more than good enough at the time. Even a VCO may not be as accurate as people might expect. Digitally done? Depends a great deal on hardware and the firmware / software. Nothing is perfect. Not unless you get into the silly expensive test gear anyway. But for our purposes, it is more than close enough.
Then of course, everything shifts with temperature, humidity and air density if you are looking closely enough.
Not "some", all the modern analysers do this. Prof Farina published the technique in 2000 and it made previous methods effectively obsolete.some may calculate the DAC values for a real sweep and send that to the DAC, a lot of work..and you couldn't tell from observation. You would need to capture and process that output to determine what they did exactly.
It is time efficient, robust to many problems, and the calculations can be done efficiently, to list just a few improvements.
Before you comment further you should read Farina's papers, they are available on-line.
The REW documentation also discusses this, it does offer a stepped sine option but cautions that it's "much, much slower".
So you can tell from observation, stepped sine is used mainly as a fallback option for extreme cases.
The swept sine formula is >here< for you to check (and a reminder for @IamJF!), as well as a detailed explanation.
Best wishes
David
Last edited:
Sorry to spread bad vibes here ...
Yes. One might sense bad vibes, depending on the individual interpretation mode. For me, while consenting with a part of your critics (or should I better write input not to potentially re-blame anybody?), I have not seen a bad vibes sprader intent. Neither in my linear, nor in my exponential perspecive window. So, for me, no bad vibes here.
Publishing means leaning out of the window. Same as for the ones who shows findings/workpieces, as for the ones who might comment about. I greatly appreciate this thread and also the fact that interesting, new and therefore immanently beta (=partly immature) info is spread, is being offered for digestion and maturing within the community. Therefore, if all this stuff gets reflected and subjected to critics, that's a process to endorse, or not? And I hope for the sake of the process' nature for critics in a positive, constructive sense. Please, all of you, go on... go on exposing yourself, while immanantly showing off your yourself a bit, and at the same time daring to eventually blame yourself a bit also. Please go on by this way improving these discussed and potentially powerful analytical methods within this argumentative merry-go-round. It's such a good mode to make things progress, to improve, and it's fun and appealing also.
I have much learned by reading these inputs until now, and also I am hoping that all this iteratively emerging knowledge will find it's way into consumer-friendly tools like REW or so.
- Home
- Loudspeakers
- Multi-Way
- Noise sensitivity of different measurement algorithms - graphs


