Lupi, looks like your havin some fun.
Im curious about the HF drop and have two questions...
1- have you done FR tests between the 10um and the 80um ribbon using say a 4 ohm resistor in series? This to eliminate the inductance effect, give both basically the same load, and see if mass has ANY effect on HF performance?
2- Also what are you driving your ribbons with? direct? transformer?
Hi lowmass
It is true, for me it is a fun pastime.
Answer to step 1:
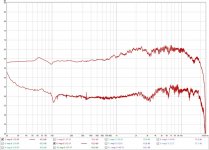
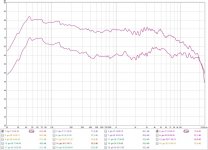
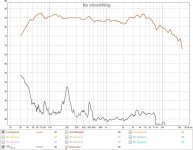
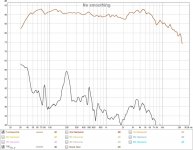
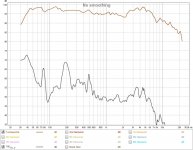
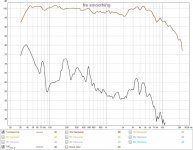
I made measurements in free air, with ribbons of either 10 or 80 um and without R in series, or with 1 ohm. I did not use higher Rs to not attenuate too much the signal. Unfortunately I did the 10 um ribbon measurements with a 0.6mm^2 1.2meters long connection cable, which has a not negligible inductance, so it increases the R series effect . The measurements on the 80 um ribbon I have instead made with a special connecting cable, with very low inductance. I send you both so you can judge yourself, taking into account the difference in the cables. Uncalibrated system, the lower curves are those with 1 ohm in series.
10um_Rserie.jpg
80um_Rserie.jpg
Answer to Step 2:
Direct driving with an amplifier I did for these tests
It is true, for me it is a fun pastime.
Answer to step 1:
I made measurements in free air, with ribbons of either 10 or 80 um and without R in series, or with 1 ohm. I did not use higher Rs to not attenuate too much the signal. Unfortunately I did the 10 um ribbon measurements with a 0.6mm^2 1.2meters long connection cable, which has a not negligible inductance, so it increases the R series effect . The measurements on the 80 um ribbon I have instead made with a special connecting cable, with very low inductance. I send you both so you can judge yourself, taking into account the difference in the cables. Uncalibrated system, the lower curves are those with 1 ohm in series.
10um_Rserie.jpg
80um_Rserie.jpg
Answer to Step 2:
Direct driving with an amplifier I did for these tests
Attachments
Very nice! This is truly a Diy Project.
Whats the name of the magnet field simulation program?
Thanks JonasKarud
The name of the magnetic field simulation program is MagNet of the infolytica corporation
Hi lowmass
It is true, for me it is a fun pastime.
Answer to step 1:
I made measurements in free air, with ribbons of either 10 or 80 um and without R in series, or with 1 ohm. I did not use higher Rs to not attenuate too much the signal. Unfortunately I did the 10 um ribbon measurements with a 0.6mm^2 1.2meters long connection cable, which has a not negligible inductance, so it increases the R series effect . The measurements on the 80 um ribbon I have instead made with a special connecting cable, with very low inductance. I send you both so you can judge yourself, taking into account the difference in the cables. Uncalibrated system, the lower curves are those with 1 ohm in series.
10um_Rserie.jpg
80um_Rserie.jpg
Answer to Step 2:
Direct driving with an amplifier I did for these tests
Ok yea not sure what effect direct drive from amp may be having here and theres a few variables that im not sure about.
The reason I ask is ether inductance OR ribbon mass should give you a drop in high frequency levels.
The last time I looked at this I think I got approximately 5-6 db drop at 20k by increasing ribbon mass about 3X. Cant remember the exact ribbon thicknesses but I think I went from 6 micron to about 18 micron thick foil. To get same load to amp I simply used a 4 ohm resistor in series with both ribbons and measured at low volumes up close.
Nice ribbon project.…I had to do the measurement with a mic at 20 cm because at higher distances the responses are altering too much. I have walls and close objects, and putting even 8 cm thick absorbents does not work…

REW provides the ability to window the impulse response to remove reflections from nearby objects and walls. The only drawback is that the length of the window limits how low in frequency the measurement is valid. If you have at least 3mS between direct impulse arrival and the first reflection, you will have a good measurement for frequencies above 500Hz. This is plenty to get a good idea of response and directivity at distances more representative of your listening position.
Attached is a guide on using the windowing technique with REW taken from:
https://www.minidsp.com/application...s/loudspeaker-measurements#gated-measurements
Attachments
With direct drive the output impedance of the amplifier can have a large effect. As you mentioned previously, when driving ribbons without a transformer it is advantageous to add series resistance to ensure constant current drive no matter what the ribbon design or amplifier output impedance is. The only drawback is the need for a more powerful amplifier and the resulting power wasted heating the resistor.Ok yea not sure what effect direct drive from amp may be having here and theres a few variables that im not sure about.
This is exactly right. Most people are familiar with high frequency roll off due to inductance forming a 1st order electrical low pass filter with a resistive load. Similarly, the ribbon mass forms a 1st order low pass filter with the resistive part of the radiation impedance (airload on the ribbon)….the only difference being that this is a mechanical/acoustical filter.…inductance OR ribbon mass should give you a drop in high frequency levels...
Above resonance, most dynamic drivers are mass controlled (ie piston mass >> airload) and the motion of the piston is dictated by the piston mass. When driven with constant force, this results in piston velocity falling -6dB/oct with increasing frequency, and a flat on-axis response when mounted in an infinite baffle or enclosure. Most woofer box design programs actually ignore the airload all together. At the other extreme, if the piston is weightless, the motion will be completely dependent on the airload. At "low" frequencies the airload acts like a mass so piston velocity and on-axis response are just like for the mass controlled case above. But at "high" frequencies things are different…the radiation impedance is resistive so constant force results in the constant piston velocity and the on-axis response tilts up at +6dB/oct.
The determination of what is meant by "low" and "high" frequencies depends on the size of the piston. The transition between flat and rising response occurs around the frequency where the wavelength of sound is similar in size to the piston diameter or width. This is usually identified as ka=1 in normalized plots shown in acoustic texts. Since ESLs tend to be much wider than ribbons, their transition frequency is lower and helps to explain why the high frequency roll off with diaphragm mass is better known by ESL builders. BTW, you will also notice that this ka=1 point is the same point at which the piston starts to become directive and highs roll off as you move off-axis. It is not a coincidence. This “beaming” is actually what keeps the on-axis response flat for a mass-controlled piston even at high frequencies.
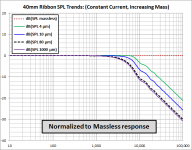
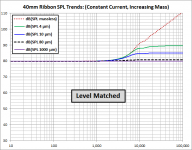
Practical ribbons tend to have mass in-between these two extremes; not small enough to be considered massless, but not heavy enough to be considered mass controlled. To illustrate, here are a few plots for a theoretical 40mm wide ribbon driven with constant current.
Attachment #1: Trends for increasing ribbon mass all driven with the same current. Note that the 80 μm is very nearly to the point of behaving like a mass-controlled piston.
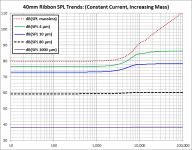
Attachment #2: The same measurements, but level matched to more easily see the trends.
Attachment #3: The same measurements, but normalized relative to the massless response to highlight the 1st order low pass behavior.
That sounds about right, assuming typical ribbon width in the 15mm – 40mm range.…The last time I looked at this I think I got approximately 5-6 db drop at 20k by increasing ribbon mass about 3X. Cant remember the exact ribbon thicknesses but I think I went from 6 micron to about 18 micron thick foil.
Attachment #4 shows a level matched comparison from several years ago between 11 μm and 2 μm ribbons driven with constant current.
They were 20mm wide dipole ribbons with minimal baffle so the response slopes downward at low frequency, but the mass effect is still clearly seen.
Attachments
Last edited:
Hi Lowmass
Bolserst described the phenomenon better than I could, and in the light of what he said, we can understand both my case, in which I had a linearization on the highs by inserting a series resistance, and yours, as long as the width of your tape is less than 40mm as in my case
lupi
Bolserst described the phenomenon better than I could, and in the light of what he said, we can understand both my case, in which I had a linearization on the highs by inserting a series resistance, and yours, as long as the width of your tape is less than 40mm as in my case
lupi
Hi bolserst
Thank you for explanation and for attachement
Until now I did the pulse response with a pulse generator and the oscilloscope, with which I can limit the window to please, but certainly with REW will be more comfortable. I will also make, at the beginning, a comparison between the oscilloscope and REW responses
lupi
Hi again ...
With a short reference to my previous post:
... reading bolserst's post above I'm pretty sure he was the other diyaudio member I remembered had made such measurements on electrostatic speakers and membrane thicknesses/weights (correct bolserst?) ... Just to wind up things ...
Cheers,
Jesper
With a short reference to my previous post:
Some other diyaudio member, I don't remember who nor in which thread, made some measurements on various thicknesses - and thus masses - of membranes and found a clear correlation between HF extension and thickness. Those that were thinner had (much) better hf extension. Made on electrostatic speakers so inductance may not matter here (?).
... reading bolserst's post above I'm pretty sure he was the other diyaudio member I remembered had made such measurements on electrostatic speakers and membrane thicknesses/weights (correct bolserst?) ... Just to wind up things ...
Cheers,
Jesper
The big benefit of limiting the time window using the REW impulse response plot is that the effect of the reflections are then also removed from the REW frequency response plot. Hopefully the instructions made that clear....Until now I did the pulse response with a pulse generator and the oscilloscope, with which I can limit the window to please, but certainly with REW will be more comfortable.
I'm not sure if this is what you were thinking of or not, but I did post some measurements showing the high frequency roll off for several different diaphragm thicknesses along with theoretical curves here:... I'm pretty sure he was the other diyaudio member I remembered had made such measurements on electrostatic speakers and membrane thicknesses/weights (correct bolserst?)
Electrostatic speakers as microphones?
More recently, Calvin posted a comparison of two diaphragm thicknesses:
I cant reach above 15Khz on my planars
Hi BolserstThe big benefit of limiting the time window using the REW impulse response plot is that the effect of the reflections are then also removed from the REW frequency response plot. Hopefully the instructions made that clear.
The instructions are very clear, only because of the haste and perhaps even presumption I had just taken a look. I did some tests and found new possibilities open.Thank you Bolserst
Now I want to describe the problem I mentioned earlier, its (I believe) to depron.
Having done countless distortion measurements of various devices, I expect the THD to be almost constant, or little increase, up to a certain level of signal, beyond which the distortion increases rapidly. Instead with this ribbon the THD gradually increases in proportion to the signal.
ribb3-30.jpg
ribb3-24.jpg ribb3-18.jpg
ribb3-15.jpg
The signal levels correspond to 0.43W, 1.72W, 6.7W and 13.4W respectively on the speaker.
By neglecting the peak of THD at 200 Hz coming out after various ribbon handling, I took into consideration all the possible causes of distortion that came to my mind:
1) Uneven field. This is not the case because the simulations give a fairly uniform field, and because the distortion increases on all frequencies up to a few hundred Hz, where the ribbon movements are minimal
2) Non-linearity of suspensions. For control I cut the side suspensions on a ribbon but did not find appreciable improvements. The end suspensions I have made it elastic with silicone rubber, so I do not think this is the case, also because distortion increases on all frequencies up to a few hundred Hz.
3) Centering the ribbon, both in thickness and in the width of the magnetic field.
I found that centering affects a lot on THD, probably due to lateral suspensions, but the change in THD is also noticeable at low signal levels.
4) Local Alu deformations that vibrate not in sync with the rest. Often they are the main cause, and I've tested them on other Alu membranes with the strobe and I even noticed it at KHz. But the Alu tape is very well glued to the depron, which in my intentions should serve to avoid this case. I have to check it out, but it's not easy because the Alu is behind the depron.
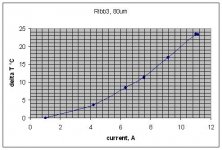
5) Thermal variation. I measured the temperature variation of Alu caused by the passing of a DC current.
ribb3_temp.JPG
6.7W on the ribbon are 9.5A eff, so in the third graph SPL above the temperature rise is less than 20 ° C, too little to cause problems directly.
In short, that is not, the other neither, I was about to throw the sponge when I noticed during the thermal tests that the ribbon, bent due to the passage of the DC current, did not immediately return straight by interrupting the current but took a couple of seconds. So the following suspect came to me, which I still have to check: The Alu and the depron behave like a bimetallic pair bending to the rise of the temperature. This may be due to the difference between the expansion coefficients and the temperature difference that the two materials assume, as the depron is a thermal isolator. Although a slight bending of the tape itself should not cause distortion, mechanical tensions in the interface could cause it, facilitating motion, e.g. forward and not behind. Now I'm thinking of how to make a check, and as soon as I get some results I'll post. Any suggestions will be welcomed.
Having done countless distortion measurements of various devices, I expect the THD to be almost constant, or little increase, up to a certain level of signal, beyond which the distortion increases rapidly. Instead with this ribbon the THD gradually increases in proportion to the signal.
ribb3-30.jpg
ribb3-24.jpg ribb3-18.jpg
ribb3-15.jpg
The signal levels correspond to 0.43W, 1.72W, 6.7W and 13.4W respectively on the speaker.
By neglecting the peak of THD at 200 Hz coming out after various ribbon handling, I took into consideration all the possible causes of distortion that came to my mind:
1) Uneven field. This is not the case because the simulations give a fairly uniform field, and because the distortion increases on all frequencies up to a few hundred Hz, where the ribbon movements are minimal
2) Non-linearity of suspensions. For control I cut the side suspensions on a ribbon but did not find appreciable improvements. The end suspensions I have made it elastic with silicone rubber, so I do not think this is the case, also because distortion increases on all frequencies up to a few hundred Hz.
3) Centering the ribbon, both in thickness and in the width of the magnetic field.
I found that centering affects a lot on THD, probably due to lateral suspensions, but the change in THD is also noticeable at low signal levels.
4) Local Alu deformations that vibrate not in sync with the rest. Often they are the main cause, and I've tested them on other Alu membranes with the strobe and I even noticed it at KHz. But the Alu tape is very well glued to the depron, which in my intentions should serve to avoid this case. I have to check it out, but it's not easy because the Alu is behind the depron.
5) Thermal variation. I measured the temperature variation of Alu caused by the passing of a DC current.
ribb3_temp.JPG
6.7W on the ribbon are 9.5A eff, so in the third graph SPL above the temperature rise is less than 20 ° C, too little to cause problems directly.
In short, that is not, the other neither, I was about to throw the sponge when I noticed during the thermal tests that the ribbon, bent due to the passage of the DC current, did not immediately return straight by interrupting the current but took a couple of seconds. So the following suspect came to me, which I still have to check: The Alu and the depron behave like a bimetallic pair bending to the rise of the temperature. This may be due to the difference between the expansion coefficients and the temperature difference that the two materials assume, as the depron is a thermal isolator. Although a slight bending of the tape itself should not cause distortion, mechanical tensions in the interface could cause it, facilitating motion, e.g. forward and not behind. Now I'm thinking of how to make a check, and as soon as I get some results I'll post. Any suggestions will be welcomed.
Attachments
Not sure really but I think typically large surface area ribbons distortion doesn't necessarily rise suddenly at higher volumes like a cone would when its driven beyond its limits. The movements in a big ribbon are small and the distortion can remain low.
I remember a saying about the Apogee ribbons, those who took them too far noticed that they "sound great right up to destruction"
I remember a saying about the Apogee ribbons, those who took them too far noticed that they "sound great right up to destruction"
@lupi,
What type of amplifier are you using when testing?
The rolled off high end suggests you are using direct drive without any series resistance. Have you measured the distortion contribution of the amplifier when driving this very low impedance load at each of the output levels?
Also, can you check the boxes below the plot to show the distortion curves for 2nd and 3rd harmonic to see what distortion type is dominant?
Another thought concerns using the swept sine stimulus for distortion measurement. You need to have the signal level near the top of the available range so that that there is enough "bits" available to calculate the distortion properly. You might consider trying to verify the distortion trend with volume level using the spectrum analyzer for a few discrete frequencies.
- Home
- Loudspeakers
- Planars & Exotics
- my ribbons full range in CB