Tom, this is basic stuff. My previous post gave all the clues as to where you are going wrong.
The LOAD of an amplifier cannot be represented by a dc current. These things are not even related to each other. The load of an amplifier is an 8-ohm resistor that dissipates power. The power = zero when idle, and Power = 70W for full load, for the 453V KT88 UL PP.
You have nothing to represent the 70W power output, and therefore you have an error of 70W plus all the other losses involved in delivering the higher output (about another 70W more)
Where do you suppose that this change is output power of 70W comes from, other than the dc supply? This is not Class A, it is AB, where the standing power in the KT88 anodes is a little over 40W idle, and a little over 50W at high power.
Your model has nothing to represent this power dissipation, and that is the first place you are led astray by oversimplification.
In the second place, you are trying to reduce the PP stage to a constant current excursion. This is a total misunderstanding.
What happens in PP in brief, for full load conditions is this:
One KT88 conducts more current, increasing to max. The anode voltage falls on this side - and the PP transformer forces it to RISE on the other side. This rising voltage on the opposite anode prevents the anode-CURRENT from falling to zero on the falling-current side (until clipping). Remember that this is UL, so the VG2 rises, too.
Thus, the AVERAGE supply current becomes the sum of the idle current plus the sum of the average currents induced by the grid voltage swing. These do NOT cancel, they are additive! Therefore, the average supply current with a signal is ALWAYS higher than the idle state.
I am not going to write out the numeric analysis here, instead I suggest that you consult:
Langford-Smith, F: "Audio Frequency Power Amplifiers" pp379
paleoelectronics.com/RDH4/CHAPTR13.PDF
or:
Moir, Jan :"High Quality Audio"
or the many other old text books that show how to do the arithmetic.
Alternatively, model the amplifier properly. This means using the Koren models for pentodes, and modelling the PP transformer & load correctly. I seem to remember that Duncan Amplification released some nicely built LTspice models of PP power amps, to save you time - if they can still be found.
The next problem is the reading of the data sheet. Where values of "Ia+Ig2 (max signal)" are given in the KT88 are other power valve data sheets, this means the AVERAGE current in the dc supply. It does not mean instantaneous current. These values are given so that equipment designers can judge how big their chokes and transformers needed to be for a given application. The average current is hard to estimate in PP stages, so these data sheet entries were provided as a great help.
About the other parasitic you have overlooked: The secondary-referred copper loss in the transformer. Yurgs has supplied measured values rather close to my 7-ohm estimate. You don't think 7 ohms matters? Well when you model the power supply accurately you will see a peak current of over 3A in this resistance - dropping 21V or more!
Tom, this is basic stuff. My previous post gave all the clues as to where you are going wrong.
Rod. I have no issues being proven wrong. I agree. This is basic stuff and I openly admit that my experience with push-pull stages has been limited to the content I've posted in this thread. I tend to learn pretty fast, though...
")
However, I don't believe I am wrong. See below.
The LOAD of an amplifier cannot be represented by a dc current. These things are not even related to each other. The load of an amplifier is an 8-ohm resistor that dissipates power. The power = zero when idle, and Power = 70W for full load, for the 453V KT88 UL PP.
I think we're getting mixed up here because the term load is used both to describe the speaker load and the load the amplifier presents to the power supply.
When we're discussing power supply design, what I mean by "load" is the load impedance or load current presented to the power supply output. In this case, the amplifier is the "load". As you stated previously, the amplifier will present a load current on the power supply of around 120 mA per channel when idle, and a higher current when delivering full power to the speaker. Obviously, the Newton's Law of energy conservation applies. I.e. the power drawn from the power supply is equal to the power delivered to the speaker plus the power dissipated in the amplifier.
I think we agree fully thus far. Am I correct?
You have nothing to represent the 70W power output, and therefore you have an error of 70W plus all the other losses involved in delivering the higher output (about another 70W more)
This is where we disagree. The power delivered to the load is already factored into the datasheet numbers that you kindly provided back in Post #47.
Thanks for the references. I have many of them in paper copy, actually. Including RDH4. I like the old texts. They're clearly written to convey a message not just rake in royalties. But they are also limited by the tools available at the time. I find them to be a good starting point, but resort to simulation for actual results.
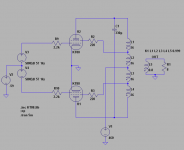
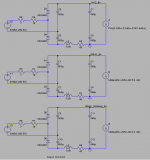
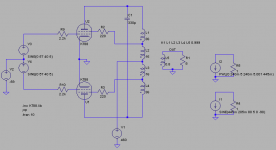
Speaking of simulations... I ran a sim of a KT88 push-pull stage. I set it up following the datasheet operating points that you posted (Post 47). I used Norman Koren's KT88 model and a modified version of a Plitron ultra-linear output transformer that he has in his library as well. The OPT model was modified to provide 4 kOhm plate-to-plate primary load with 8 ohm on the secondary. The UL taps are at 40 %. I have included a parasitic resistance (not plotted on the schematic, but included with the inductors L1 through L4) of 1 kOhm total from plate to plate distributed according to the turns ratio between the different windings.
RESULTS:
At the datasheet operating point, I get 50.9 mA per anode (datasheet: 50 mA).
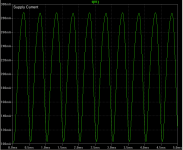
The peak supply current is 288 mA (datasheet: 280 mA).
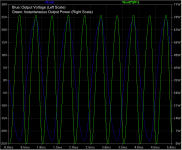
Peak power delivered to 8 ohm speaker load: 70.8 W (datasheet: 70 W).
RMS power delivered to 8 ohm speaker load: Approx 40 W.
Above at 1 kHz sine input.
See attached for details. I have attached the LTspice simulation file (.asc) for those interested in reproducing my results. I have also attached the KT88 model I'm using (rename KT88.txt to KT88.lib - DIYAudio did not like the .lib extension).
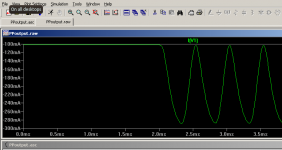
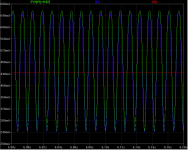
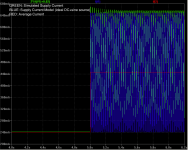
Now, have a look at the plot of the supply current. It certainly is not a step function. In fact, it is quite similar to the ideal DC+sine I used in my power supply sim back in Post #57 with the supply current plotted in Post #59. Note that the supply current plot attached to this post is for one channel and does not include the 20 mA per channel of static current drawn by the input stage and phase splitter.
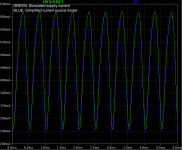
The last plot shows the simulated supply current (green) vs the ideal current source model (blue). For the simulation, I added 20 mA constant (input stage, phase splitter) and multiplied by 2 (two channels). The blue curve was generated using the same ideal source as I used for Posts #57 and #59 except I changed the frequency to 2 kHz and adjusted the phase by 90 degrees to make the curves line up.
We actually both missed the fact that a P-P output stage draws current at 2x the input signal frequency (DUH!)
Now, the two currents aren't exactly line-on-line. But pretty damn close. The discrepancies are caused by output stage distortion (doesn't draw a perfect sine wave current) and a slight difference in operating point versus the datasheet values.
Would you agree that the DC+sine signal I used in my original sim is a reasonable first order approximation of the actual supply current drawn by the amplifier?
~Tom
Attachments
@Tom, there are measurements of B+ in post#52
Quote: At 1 kHz there's 250 mVpp ripple on B+
>matches what i measured
Sweet.
if i understand you guys right here there are stability issues with doublers,
the sizing of the tranny is correct, would it improve stability to use 2 doublers, one for output tubes and one for input circuit
(other option would be to use one for each channel)
Depends on what you mean by "stability issues". Let me explain...
All unregulated supplies will sag when you draw current from them. The amount of the voltage sag depends on the current drawn, capacitance of the reservoir caps, and the mains frequency. Why the mains frequency, you may ask. Well... Picture this. For a full-wave rectifier, the charge in the reservoir cap is "topped off" twice per mains cycle - so 100 times per second for a 50 Hz mains system.
However, with a voltage doubler, the reservoir cap charge is only refilled once per mains cycle (50 times/second). So for the same load current, the voltage sag in a voltage doubler supply will be roughly twice that of a normal supply.
In addition, the voltage doubler draws roughly twice the output current from the mains transformer. This means the rectifier diodes conduct twice the current and the two caps in the doubler circuit will handle substantial ripple current.
It's really not a "nice" circuit. My preference is clearly to use a power transformer that delivers enough voltage for the needed B+ voltage without the use of a doubler circuit.
However, this does not mean that a voltage doubler won't work if properly designed. My simulation shows that your circuit should work.
The best thing you can do for your supply is to put a regulator on B+. Note, though, that you will need to ensure that there's at least 15~20 V across the regulator at all times (including under heavy load). So if your current B+ is 475 V at nominal mains voltage, don't plan for more than about 430 V out. (475 - 5 % - 20 V). No more than 400~410 V if you plan for 10 % excursions on the mains voltage.
But before installing a regulator, I think you need to figure out what's going on with your amp.
As I recall, it did work before you made a bunch of modifications to it. How about reversing all the mods and verifying that the amp works. Then apply one modification at a time.
One concern I have with your CCS is that you have about 270 V on the base of the MJE350 in the input stage. This means that the MJE350 will be driven into saturation if the anode voltage on the input tube exceeds 270 V. This may be the case at high input volume. That's certainly something I'd check.
I would also measure the voltage across the 10 ohm cathode resistors in the output stage to find out why the LEDs in the protection circuit are lighting up. Is it because of low current or high current?
~Tom
Speaking of simulations... I ran a sim of a KT88 push-pull stage. I set it up following the datasheet operating points that you posted (Post 47). I used Norman Koren's KT88 model and a modified version of a Plitron ultra-linear output transformer that he has in his library as well. The OPT model was modified to provide 4 kOhm plate-to-plate primary load with 8 ohm on the secondary. The UL taps are at 40 %. I have included a parasitic resistance (not plotted on the schematic, but included with the inductors L1 through L4) of 1 kOhm total from plate to plate distributed according to the turns ratio between the different windings.
Hi, tomchr,
Where did you find transformer spice model? Is there any model with bot UL and CFB?
Thanks.
Would you agree that the DC+sine signal I used in my original sim is a reasonable first order approximation of the actual supply current drawn by the amplifier?
~Tom
No. This is the fundamental misunderstanding that is leading you to believe that the average supply current is the same at all times.
DC + sine means that the current rises from the idle value during one half-cycle of the signal, and then declines below the idle value during the second half-cycle. Net result: average current is the same as the idle value.
What really happens is easily shown by modifying your sim to show the current in idle phase as well as the active mode. See attached. The Current rises in the first half-cycle, just like your sinus model, but in the second half-cycle, it also rises! Here is the vital difference that you are missing. The current waveform is like a full-wave rectified sinusoidal draw, NOT a raw sinusoid.
This waveform gives rise to an increase in average supply current. This has to be the case with class AB, or no power could be delivered to the load.
The full-wave rectified waveform also explains why you get double the signal frequency is the supply current. No, I did not miss this - it is what I meant by the 2 PP-halves signal current contributing "additively" to the supply current.
Ignoring the differences in magnitude, the PSUD2 shot that I posted in the first instance is intended to illustrate the effect of an increase in average supply current. Do not be distracted by the step change shown. It does not matter if the rise time is 3 minutes. The effect I am demonstrating is the sag in supply voltage due to increase in average supply current.
If you're quick to learn, here is the problem to grasp! It is worked out numerically in exquisite detail, in the page-reference of Langford-Smith I noted earlier.
Attachments
Yurgs, I think you are right that the motorboating will be stopped by a regulated supply. I am reading Reich's "Principles of Electron Tubes" "Because of variation of voltage drop through rectifier and filter the terminal voltage of a B+ supply varies with current drain." This is a low frequency feedback. Recommendation is use chokes instead of resistors to improve on the sag in B+. Also decouple each tube with a cap. Have you thought of decoupling the - ~80v supply from the -24v supply with a cap across the lower resistor. There is a 1000uF cap for both of those supplies. (?)
This waveform gives rise to an increase in average supply current. This has to be the case with class AB, or no power could be delivered to the load.
Rod. We agree 100 % there.
When the amp goes from idle to full signal, the average current does increase. This is intuitively obvious on the plot. My DC+sine current source models only the full signal portion. Thus, my ideal DC+sine model will give you the worst case current draw, hence, worst case voltage ripple/sag. It does not predict what happens when the amp goes from idle to full signal, nor was it intended to.
My main argument is that your model in Post #47 is flawed. The load current should go from 240 mA to 420 mA as those are the average currents during idle and max signal.
I don't see much point in simulating with the average currents, though. That may give you some comfort that it matches the textbook equations, but in reality, you'll get better results if your simulation model actually matches reality. And while the average current draw may be a step function as signal is applied, the instantaneous current certainly is not. And in the end, it's the instantaneous current that matters.
~Tom
Hey richy, its not a torroid, its a standart type with pretty good iron, and i got the info about it from the same guy who initially designed the powersuply,as described here PowertransformatorI remain unconvinced the current doubler psu is to blame for all the problems: I've seen far worse circuits around that DO work.
Yurgs:
What make o/p tranny are you using ? Is it a toroid ?
richy
I remain unconvinced the current doubler psu is to blame for all the problems: I've seen far worse circuits around that DO work.
I would tend to agree. Aside from design complexity, the main drawback of the voltage doubler is that compared to a regular supply, twice the current flows in the transformer secondary. This means the voltage drop across the secondary DC resistance (and the 18 ohm series resistor) will be higher as well. However, in this case I do not believe it's the cause of the issues the yurgs was facing.
~Tom
No. This is the fundamental misunderstanding that is leading you to believe that the average supply current is the same at all times.
Perhaps I failed to communicate that I was running a worst-case simulation. I.e. supply voltage at max power output. I don't see much point in running a simulation at idle if we're trying to identify issues that arrise when the amplifier is delivering high output power.
Yeah... The B+ voltage droops as you draw more current. That should be no surprise to anybody. You're pulling charge out of the reservoir cap at a faster rate and dropping more voltage across the transformer secondary DCR and other series resistors. This would happen with any un-regulated supply. That's why I built my high voltage regulators in the first place.
I still believe your simulation in Post #47 uses the incorrect value for the average current drawn during max output power. The correct value should be 420 mA based on the values you list in that post.
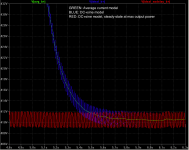
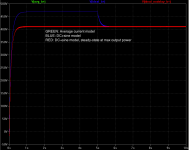
I tweaked my DC+sine model to match the amp simulation a bit more closely. I'm running 445 mA DC + 205 mA sine as the simulation of the amp current draw under max output power conditions. This includes the power delivered via the output transformer to the 8 ohm speaker load. I also added a model that simulates the average current draw.
The average current model will predict the average B+ voltage under load. It will not predict the ripple voltage. The DC+sine model will predict the ripple voltage.
The sims really speak for themselves. Can we get back to helping yurgs fix his amp now?
~Tom
Attachments
Last edited:
Where did you find transformer spice model? Is there any model with bot UL and CFB?
I started with a model in Norman Koren's Tube1.lib PSpice tube library and modified it to suit my needs. His model used 392 H primary inductance, I rounded up to 400...
The UL taps are 40 % down from B+. I.e. 40 % of the total number of turns for that side of the primary (or 20 % of the total primary). Recall, impedances in a transformer are proportional to the turns ratio squared. So...
400 H primary inductance measured from anode to anode connection.
UL tap inductance (20 % of the total number of turns): 400 * (0.2)^2 = 16 H
Remaining part of primary (30 % of the total number of turns): 400 * (0.3)^2 = 36 H
Then just copy that for the other half of the primary.
Now we just need to add the speaker winding. I used 4 kOhm anode-anode primary impedance and 8 ohm speaker load. So the impedance ratio is 8/4000. The inductances follow the same ratio. Hence, the speaker winding inductance is:
400 * 8/4000 = 0.8 H
The K1 parameter is the coupling between the different windings (inductors). An ideal transformer would have a coupling coefficient of 1.0. I account for a little loss by using 0.999.
You can add windings by following my math above and including the winding (inductor) in the list following the Spice directive K1.
~Tom
Rod. We agree 100 % there.
When the amp goes from idle to full signal, the average current does increase. This is intuitively obvious on the plot.
OK, so now compare that to what you said in post 59:
As the input signal swings from zero to its maximum value, the current in one half of the output stage swings from its idle value of 100 mA to its peak value of 280 mA. As the input signals swings back down from its peak value to zero, the current in the output stage swings back to the idle value. When the signal swings negative, the current in that half of the output stage decreases. The opposite is true for the other half of the output stage as they're driven 180 degrees out of phase.
Is this not the case?
If it is the case, I would think that a push-pull stage would draw a nearly constant current. Should this not be the case, please let me know. I am mostly experienced with single-ended output stages. I don't mind being wrong as long as you back your claims up with measurements or simulations.
Well, I am glad to see that you now accept that this was wrong.
My DC+sine current source models only the full signal portion. Thus, my ideal DC+sine model will give you the worst case current draw, hence, worst case voltage ripple/sag.
Modelling the UL PP supply current with dc+sine is simply an error, as I have explained in detail. The actual current waveform resembles a full-wave rectified sinusoid. These waveforms are neither the same, nor are they equivalent in dc, average, or instantaneous terms. Not in Current terms, nor in Power terms.
Making false assumptions about the waveform means that you are publishing results that are worthless.
My main argument is that your model in Post #47 is flawed. The load current should go from 240 mA to 420 mA as those are the average currents during idle and max signal.
This is merely arithmetic, or reading error on your part.
To repeat the data sheet quote:
Marconi Osram KT88 Data Sheet said:Ia+g2(0) .............. 2x 50mA
Ia+g2(Max Signal) ..... 2x 140mA
I added 20mA for each voltage amp.
For each channel, supply current rises from 120mA to 300mA. For 2 channels the current is obviously 240mA to 600mA. What could be simpler?
I realise that you have never actually designed a PP amplifier, and therefore will not know what to expect, but you are surely not interpreting the data sheet values as instantaneous, rather than dc values? Nothing so basic? Do I have to do a Data Sheet 101 as well as the PP PSU 101?
I don't see much point in simulating with the average currents, though. That may give you some comfort that it matches the textbook equations, but in reality, you'll get better results if your simulation model actually matches reality. And while the average current draw may be a step function as signal is applied, the instantaneous current certainly is not. And in the end, it's the instantaneous current that matters.
~Tom
The average (or dc) current measurements are the only way to predict the difference between the dc supply voltage at idle, and the dc supply voltage with the amp playing at full load. If you do not understand the relevance of those values, you are very ill-qualified to try to apply voltage regulators to another fellow's equipment. The more so when combined with the many errors you make in (under)estimating the supply current that they will have to handle.
Yurgs, I'm sorry that all this basic instruction about PP Power Supply design, and the large quantity of variable criticism it has attracted - has landed in your thread. It was certainly not my intention that this should happen. I hope that you'll understand that I should properly answer it though. I hope to be able to help, whether the problem is the power supply, or something else.
The measurement that you made which seems most unexpected is the 8R load voltage that produced clipping (17V). This is certainly lower than expected. Is this voltage a peak or rms value?
What is the specified Anode-to-Anode Impedance of the output transformer (uebertrager)? If this is greatly mismatched, we may have a problem.
Modelling the UL PP supply current with dc+sine is simply an error
Yet, as you can see from my simulations - should you actually look at the plots I've attached - my DC+sine model tracks the simulated current of the output stage. I used the models you referred to for the KT88.
The simulation results speak pretty clearly for themselves, I think...
For each channel, supply current rises from 120mA to 300mA. For 2 channels the current is obviously 240mA to 600mA. What could be simpler?
Correct. The current rises from 240 mA to 600 mA as the instantaneous voltage of input signal goes from zero to its peak value. The current goes back down to 240 mA when the input signal's instantaneous voltage goes back to zero. This is clearly modeled by my simulations and you can go back and look at the plots to convince yourself of this.
I realise that you have never actually designed a PP amplifier, and therefore will not know what to expect,
I think anybody who has read my posts on this thread should be able to conclude by now that I have a pretty good grasp of the fundamentals here. That's in part what simulations give a circuit designer.
My simulations above reproduce all the parameters in the datasheet blurb to within a few percent of the datasheet values. The DC operating point is dead on. I have full confidence that the models I use are correct and accurate. I have full confidence in the simulation.
In the simulation plots I show the simulated curves as well as my modelled curves for the current draw. It's easy for everybody to perform a visual comparison of the curves. I have full confidence in my models and believe they will produce reasonably accurate results.
If you don't believe in the simulations, I suggest that you build the circuit, measure the supply current, and report back with the results.
but you are surely not interpreting the data sheet values as instantaneous, rather than dc values? Nothing so basic? Do I have to do a Data Sheet 101 as well as the PP PSU 101?
Rod. There's really no reason to be nasty here. There's also no reason to spread fear, uncertainty, and doubt (FUD) about my skill set.
Have a nice day.
~Tom
What is the specified Anode-to-Anode Impedance of the output transformer (uebertrager)? If this is greatly mismatched, we may have a problem.
The schematic in Post #2 says 5k:3.85ohm for the OPT. I interpret this as a 5k primary when loaded by 3.85 ohm on the secondary. If this is correct, then I suggest using a 3.9 ohm or 4 ohm dummy load. If an 8 ohm load is used, the primary impedance will be closer to 10 kOhm, resulting in lower output power.
~Tom
- Status
- This old topic is closed. If you want to reopen this topic, contact a moderator using the "Report Post" button.
- Home
- Amplifiers
- Tubes / Valves
- My amp is motorboating, improve it with b+ regulator ?