It's on its way, (too many distractions!).....The 150+ repeated plays in succession with logical VTF and a barely descent cart/arm, don't support any horror stories.
One day when Luchy will show his analysis results, we will be able to put this subject to rest.
The progressive 150 Stanton results - the before/after 150 play results from the Shure control are already posted, and show no change to lf stability, fundamental amplitude, mid f noise floor, nor 3rd harmonic distortion, and only a small degradation in 2nd harmonic distortion, across the audioband.
That it is still very usable pretty much says it all, IMO !If someone wants the test disc on which I performed these tests for visual investigation, I may post it to him, provided he will return it (or a copy of the same) back
LD
Thanks to Hiten for finding and posting a link to Walton's 1963 WW article. A few years had moved on since 1961, but looks like the same SEM images were still the basis of discussions.
Putting aside the narrative, the article hints at image 'flattening', which I take to mean scaling the vertical size by an increase of sqrt(2) so one can look at the surfaces of both grooves at the same linear and vertical scale. However, although the author doesn't describe what is meant by flattening, a factor of sqrt(2) would tally with top groove width being about 60um, much more reasonable IMO.
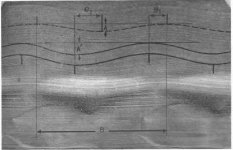
Attached is a geometric markup, mostly Walton's, with addition of dimension B the wavelength of recorded tone. The ratio of dimensions B to A is at issue.
IMO, this image is reasonable proof that the test record can't have been SXL 2057 (10kHz one channel 5cm/s rms at 14cm radius). However it is consistent with 10kHz one channel 15cm/s rms at 14cm radius which (elsewhere) the author considered a target for trackability. Which is extreme.
Personally, I doubt the track portrayed by the image is trackable by any 'normal' cartridge, representing about 1350G acceleration.
So my personal opinion of the likely circumstance of this series of SEMs is that it involved permanent damage probably caused by mistracking an extremely testing track, and use of excessive VTFs in an attempt to force the stylus to trace. But it appears as though the stylus bounced along the modulated wall, hitting rising slopes and elevations, whilst tracing its own locus which had not much to do with tracing the groove, other than the 10kHz once per cycle touchdown. Hence the weird phase offset and unnatural duty cycle. On some of the SEMs, I speculate that excessive VTF led to gouging of the unmodulated wall.
My opinion is that discussion/theorising on the basis of those SEMs should only embrace the most likely test conditions, which unfortunately appear different from those described/used as the basis for much narrative discussion and conclusion.
Thanks again, Hiten, for the pointer !
LD
Putting aside the narrative, the article hints at image 'flattening', which I take to mean scaling the vertical size by an increase of sqrt(2) so one can look at the surfaces of both grooves at the same linear and vertical scale. However, although the author doesn't describe what is meant by flattening, a factor of sqrt(2) would tally with top groove width being about 60um, much more reasonable IMO.
Attached is a geometric markup, mostly Walton's, with addition of dimension B the wavelength of recorded tone. The ratio of dimensions B to A is at issue.
IMO, this image is reasonable proof that the test record can't have been SXL 2057 (10kHz one channel 5cm/s rms at 14cm radius). However it is consistent with 10kHz one channel 15cm/s rms at 14cm radius which (elsewhere) the author considered a target for trackability. Which is extreme.
Personally, I doubt the track portrayed by the image is trackable by any 'normal' cartridge, representing about 1350G acceleration.
So my personal opinion of the likely circumstance of this series of SEMs is that it involved permanent damage probably caused by mistracking an extremely testing track, and use of excessive VTFs in an attempt to force the stylus to trace. But it appears as though the stylus bounced along the modulated wall, hitting rising slopes and elevations, whilst tracing its own locus which had not much to do with tracing the groove, other than the 10kHz once per cycle touchdown. Hence the weird phase offset and unnatural duty cycle. On some of the SEMs, I speculate that excessive VTF led to gouging of the unmodulated wall.
My opinion is that discussion/theorising on the basis of those SEMs should only embrace the most likely test conditions, which unfortunately appear different from those described/used as the basis for much narrative discussion and conclusion.
Thanks again, Hiten, for the pointer !
LD
Attachments
There is a vinyl collector here who has around 3/4000 vinyls. If listened 10 albums per day those same albums will come next year if played in sequence.OTOH I wonder how many of my lp's have seen 50 plays
I have around 170 vinyls. few days back I listened to Duke Ellington with his all star band. I don't remember exactly but can guess my previous listen was about 3/4 months back.
Last edited:
Thanks LD. It will be difficult for me to understand the images and the measurement sizes.
Let that book/links be guidelines and results of hardwork by gpapag and analysis by you and other be conclusive demonstration that vinyl doesn't degrade so much so as to be noticed after multiple plays.
Regards.
Let that book/links be guidelines and results of hardwork by gpapag and analysis by you and other be conclusive demonstration that vinyl doesn't degrade so much so as to be noticed after multiple plays.
Regards.
I find that what degrades vinyl most is playing with open cover with dust falling on the record and getting it out and into the sleeve.
I read a compelling article which said that the groves themselves showed a little more distortion after at least 100 plays, and could be heard after 200 plays. If you play it, wash it regularly and play with a diamond stylus relatively new there is no harm to vinyl.
I read a compelling article which said that the groves themselves showed a little more distortion after at least 100 plays, and could be heard after 200 plays. If you play it, wash it regularly and play with a diamond stylus relatively new there is no harm to vinyl.
Yes, thanks again for the WW article. Form that and Bill's scans we can conclude that it isn't the Decca LP, as it's stated that only one wall is modulated. I don't see anything on the Decca test LP to indicate modulation to only one channel. Has anyone else - I don't have the disc.
Also from the WW we can conclude that that the signal wavelength is 48.76µm. It is given as a 10,000 kc/s signal at 11 inches. That means 48.76 cm/s linear speed at that diameter resulting in a 10kHz wavelength of 48.76 microns. Using that scale it puts the groove width at 68µm, right about where it should be.
You might want to check my math on that.
I have around 170 vinyls.
I've culled down to 200 or so. My impression is that many folks, when they sit down to listen to a bunch of LP's, have one or two that always get tossed in more often. I have a few of Sibelius' tone poems and the BBC soundtrack by Inti-Illimani that have (I assume >50 plays) and are none the worse.
I suspect the flattening was a double exposure with rotation of the sample so the elecron beam was impinging directly on the wall of the groove rather than from above. That may be the 'special technique'. Bearing in mind that the first commercial SEM was 1965 whatever they were using at salford was either a lash up or borrowed time on another machine.
Dennis McMullan Scanning Microscope suggests that there were no more than 5 SEMs in UK in 1961. This really was bleeding edge stuff!
Edit: Scott I am horrified. I imagined your retirement place with a gigantic wall of vinyl")
Dennis McMullan Scanning Microscope suggests that there were no more than 5 SEMs in UK in 1961. This really was bleeding edge stuff!
Edit: Scott I am horrified. I imagined your retirement place with a gigantic wall of vinyl
Edit: Scott I am horrified. I imagined your retirement place with a gigantic wall of vinyl
Cases have gone to someone else who does have WALLS of vinyl, same with >2000 DVD's. I mean am I really going to listen to Herman's Hermits again (we don't do the Freddie here anymore either).
Our greatest moments are documented forever now whether we like it or not.
Freddie & The Dreamers - Do the Freddie ft. other Hullabaloo Guest Stars - YouTube
Last edited:
OK, wild guess, but AEI made one SEM in 1959, which wasn't much cop so they gave up and stuck with TEM. AEI were based in manchester so I reckon that is the unit that was used for these images. As the same images come around it may be that time for homers was very limited
Pano, There are images online of the Decca test record . Side1 has bands of left channel frequency tones, Side 2 has right channel. The 10 kHz test tone is the second band in from outside..
No Artist - Stereophonic Frequency Test Record (Vinyl, LP) at Discogs
No Artist - Stereophonic Frequency Test Record (Vinyl, LP) at Discogs
Yes, perhaps - that would give the same result, that one is effectively looking at the groove faces flat on with the same vertical and linear scales..........I suspect the flattening was a double exposure with rotation of the sample so the elecron beam was impinging directly on the wall of the groove rather than from above. That may be the 'special technique'. Bearing in mind that the first commercial SEM was 1965 whatever they were using at salford was either a lash up or borrowed time on another machine.
That would still imply the test record isn't Decca SXL 2057 though.
The image is definitely one channel only modulated, BTW, Pano. The marks at A are witness lines from the cutterhead, following the groove base up and down which happens when one channel only is modulated.
LD

The wavelength works out correctly for 10kHz, but the issue is the modulation amplitude which works out about x3 what it should be for SXL 2057................ on the markup amplitude is A, and wavelength is B.Given that, maybe it does work out to be the Decca LP after all - if my wavelengths are correct.
LD
Last edited:
I just realised that I had never considered what 5cm/s in one channel only actually looks like.
Anyway of Aurak and frankencartridges. I just have to add gain and load resistors to my mouser order and good to go. LD: what do you want to test with. I assume the serato, as i tried to fit an S-120 stylus onto a super OM body and it doesn't quite fit due to the moulding. Whilst doing this I took a closer look at the magic second bung and that is sized to fit the fat cantilever so choices would either be new diamond on that or a cut and shut. Not ideal.
Anyway of Aurak and frankencartridges. I just have to add gain and load resistors to my mouser order and good to go. LD: what do you want to test with. I assume the serato, as i tried to fit an S-120 stylus onto a super OM body and it doesn't quite fit due to the moulding. Whilst doing this I took a closer look at the magic second bung and that is sized to fit the fat cantilever so choices would either be new diamond on that or a cut and shut. Not ideal.
Walton's August 1961 Wireless World article that Bill previously cited has the same SEMs with the following explanation of how they were obtained. The "flattening" is mentioned.
". . .all these micrographs are of the 10kc/s band of the Decca stereo frequency test record (SXL 2057). This photographic evidence has been prepared by Dr. P. Chippendale of the Royal College of Advanced Technology, Salford, by a process which he has specially developed. The electro micrographs are taken from carbon replicas of the groove walls. During the replicating process the carbon film becomes somewhat flattened and therefore some of the indentations will in fact be deeper than they appear. There is also some buckling at the bottom of the groove (appearing lighter). Small cracks occasionally appear in the replica because of the very delicate nature of the carbon film. In spite of this the lines left by the cutter still provide a datum for accurate quantitative interpretation."
Incidentally, does anyone has access to archives of Wireless World other than at American Radio History: Documenting the History of Radio TV and FM
broadcasting One page is missing from Walton's article there. It's page 408 from the August 1961 issue of WW.
Thanks Charlie. I don't doubt in good faith Walton believed that to be true. However, the SEMs apparently contradict that the record could have been SXL 2057. Here's a proof of the contradiction that one can check over for oneself:Walton's August 1961 Wireless World article that Bill previously cited has the same SEMs with the following explanation of how they were obtained. The "flattening" is mentioned.
". . .all these micrographs are of the 10kc/s band of the Decca stereo frequency test record (SXL 2057). This photographic evidence has been prepared by Dr. P. Chippendale of the Royal College of Advanced Technology, Salford, by a process which he has specially developed. The electro micrographs are taken from carbon replicas of the groove walls. During the replicating process the carbon film becomes somewhat flattened and therefore some of the indentations will in fact be deeper than they appear. There is also some buckling at the bottom of the groove (appearing lighter). Small cracks occasionally appear in the replica because of the very delicate nature of the carbon film. In spite of this the lines left by the cutter still provide a datum for accurate quantitative interpretation."
Consider just the unmodulated wall cutter head witness marks on the SEM, which Walton acknowledges, and the vertical motion of the cutterhead they have recorded.
For sine modulation D = Dpeak sin(wt) [m] (1)
where Dpeak = peak displacement [m]
Instaneous velocity = dD/dt = wDpeak cos(wt) [m/s] (2)
Peak velocity Vpeak = wDpeak (when cos(wt)=1) [m/s] (3)
Rearranging (3):
Dpeak = Vpeak/w [m] (4)
______________
For Decca SXL 2057: V = 0.05 [m/s] rms, f = 10kHz [Hz]
Vpeak = 0.05 * sqrt(2) = 0.071 [m/s] (5) ; converting rms to peak for sine
w = 2 * pi() * 10000 = 62831 [radians/s] (6)
Substituting into (4)
Dpeak = 0.071/62831 = 1.1E-6 = 1.1 um [um] (7)
Dpeak direction is normal to 45 deg groove wall.
Vertical peak displacement Dpeakvertical = Dpeak/sqrt(2) [m] (8)
Then Dpeakvertical = 1.1E-6/sqrt(2) = 0.8E-6 [m] = 0.80 [um]
________________
From (8), Decca SXL peak vertical displacement of witness marks from cutter head = 0.8um (9)
From SEMs, using 10kHz wavelength (B) as a scale marker, verified by top groove width, measured peak vertical displacement (A) of cutter head = 3.0 um/sqrt(2) = 2.1um .....or 3.0 um if not 'flattened' (10)
Allowing reasonably for arithmetic and measurement error, (9) and (10) are certainly contradictory. Therefore that the SEM is an image of Decca SXL2057 as described is shown to be contradicted.
This is why I consider the SEMs can't be for SXL 2057 as described.
LD
Last edited:
A further 2p worth of comment:Walton's August 1961 Wireless World article that Bill previously cited has the same SEMs with the following explanation of how they were obtained. The "flattening" is mentioned.
". . .all these micrographs are of the 10kc/s band of the Decca stereo frequency test record (SXL 2057). This photographic evidence has been prepared by Dr. P. Chippendale of the Royal College of Advanced Technology, Salford, by a process which he has specially developed. The electro micrographs are taken from carbon replicas of the groove walls. During the replicating process the carbon film becomes somewhat flattened and therefore some of the indentations will in fact be deeper than they appear. There is also some buckling at the bottom of the groove (appearing lighter). Small cracks occasionally appear in the replica because of the very delicate nature of the carbon film. In spite of this the lines left by the cutter still provide a datum for accurate quantitative interpretation."
1961 would have been very early days for SEMs, and the process of carbon sputter coating a sample might have then been considered new I suppose? A sample has to be conductive for SEMs to work, of course, things we now take for granted. The coating might fill voids to an extent and thus 'flatten' the surface, though the witness marks from the cutter head on the unmodulated groove wall are plainly visible.
BTW, in my post above w is angular frequency, 2πf, and [square brackets] just state units or dimensions, of course.
LD
Last edited:
- Home
- Source & Line
- Analogue Source
- mechanical resonance in MMs