From the literature I am reading, a lot of new designs for oscillators exist using CFA (like AD844). And, new topologies that require only a single R for tuning freq. "Current Feedback Operational Amplifiers and their Applications" By Raj Senani et al. Springer 2013.
also see www. springer.com/series/7381.
THx-RNMarsh
also see www. springer.com/series/7381.
THx-RNMarsh
Last edited:
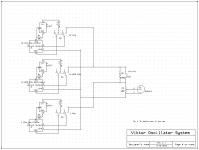
My setup with Viktor's oscillators
I thought it would be appropriate for me to post how I implemented Viktors oscillators in a system. I got stymied for about a year by a set of NICAD batteries from eBay. It turns out they were defective, but that actually forced me to rethink the whole concept. I measured the required current to operate the oscillators (about 15 mA) and checked that against generic 9V batteries. I should be able to get 10-15 hours from a set of 9V batteries. So I revised the circuit using an LM317 as a current source programmed to 16 mA, bypassed the 100 Ohm resistors on the supply, connected 4 9V batteries in series and it works like a champ. My array has 3 oscillators, each with a separate battery to keep interactions minimized. It also has a series resistor to get the SMPTE 4:1 ratio for IM testing and a 600 Ohm Daven decade attenuator (everyone has these in their junk boxes, don't they?). The whole thing is crammed into a reused cast aluminium box and looks pretty ratty but works quite well.
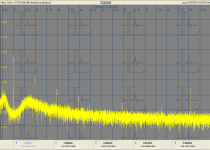
The two plots are first the oscillator through my Shibasoku 725 and second the oscillator through my B&K 1607 completely passive. It is not corrected for attenuation of the 2nd (add 10 dB) and 3rd (add 5 dB) harmonics (it has that feature but with a -20 dB loss for everything which would bury it all in the noise).
This turns out to be a really useful reference for tweaking distortion analyzers and checking high performance ADC's. All up probably not more that $200 (if you have or dispense with the decade attenuator).
I thought it would be appropriate for me to post how I implemented Viktors oscillators in a system. I got stymied for about a year by a set of NICAD batteries from eBay. It turns out they were defective, but that actually forced me to rethink the whole concept. I measured the required current to operate the oscillators (about 15 mA) and checked that against generic 9V batteries. I should be able to get 10-15 hours from a set of 9V batteries. So I revised the circuit using an LM317 as a current source programmed to 16 mA, bypassed the 100 Ohm resistors on the supply, connected 4 9V batteries in series and it works like a champ. My array has 3 oscillators, each with a separate battery to keep interactions minimized. It also has a series resistor to get the SMPTE 4:1 ratio for IM testing and a 600 Ohm Daven decade attenuator (everyone has these in their junk boxes, don't they?). The whole thing is crammed into a reused cast aluminium box and looks pretty ratty but works quite well.
The two plots are first the oscillator through my Shibasoku 725 and second the oscillator through my B&K 1607 completely passive. It is not corrected for attenuation of the 2nd (add 10 dB) and 3rd (add 5 dB) harmonics (it has that feature but with a -20 dB loss for everything which would bury it all in the noise).
This turns out to be a really useful reference for tweaking distortion analyzers and checking high performance ADC's. All up probably not more that $200 (if you have or dispense with the decade attenuator).
Attachments
The two plots are first the oscillator through my Shibasoku 725 and second the oscillator through my B&K 1607 completely passive. It is not corrected for attenuation of the 2nd (add 10 dB) and 3rd (add 5 dB) harmonics (it has that feature but with a -20 dB loss for everything which would bury it all in the noise).
It looks like both the 2H match -- -140db. But the 3H doesnt.... -150 and -140dB 10dB difference. yes? no?
-RM
On the harmonics, I'm aware they don't match and I need to dig deeper still. However this is all deep into the cancellation turf so I'm not sure what it happening. -150 is almost certainly not real. On the AK5397- no news yet. its back getting some complex and difficult fix for an overload related problem.
On the harmonics, I'm aware they don't match and I need to dig deeper still. However this is all deep into the cancellation turf so I'm not sure what it happening. -150 is almost certainly not real. On the AK5397- no news yet. its back getting some complex and difficult fix for an overload related problem.
Hi 1audio,
I have been expecting AK5397 for a long long time. Do you have any news from AKM application engineer or someone?
Thank you.
BR
Paul
I was looking at the harmonics and while they are not identical they are within about 5 dB or less when the corrections are accounted for.
On closer visual inspection, yes uncorrected is about -5dB error. However, are either of them accurate? - compare with the newer ShibaSoku 725D's monitor output?
I'd do the side-by-side test with the AP2722 but i leave the country in 2 days.
Very, very respectable to say the least..... Quit a nice accomplishment.

How easy will it be to duplicate by other DIY's for the whole test system? HW/SW. Can you now put up the completed - all together in one place - system schematic? OR ??
THx-RNMarsh
Last edited:
RE: AK 5397 Both the sales guy and the local FAE called me to tell me that it was delayed again. Something about a problem when its overloaded. I'll certainly let all know when its real.
Thank you.
It seems that I have to start a AK5394AVS project first now.
I got ATS-2 from audio precision, but the analyzer is not good enough to many projects of mine.
Thanks again.
Last edited:
On closer visual inspection, yes uncorrected is about -5dB error. However, are either of them accurate? - compare with the newer ShibaSoku 725D's monitor output?
I'd do the side-by-side test with the AP2722 but i leave the country in 2 days.
Very, very respectable to say the least..... Quit a nice accomplishment.
How easy will it be to duplicate by other DIY's for the whole test system? HW/SW. Can you now put up the completed - all together in one place - system schematic? OR ??
THx-RNMarsh
The deeper you go the more complex it all gets. . .
First, I set everything up to do the measurements simultaneously so any differences will be analyzer only. However this highlights the problems of measuring this way. Both the new and old Shibasoku analyzers impact the signal some. They both load the oscillators 600 Ohm output enough to change levels and when connected alter the source distortion some.
Here is a quick matrix (I can't connect the B&K 1607 output to an external device because the grounding and loading are affecting things- that's a pending to-do to deal with).
(Source is Viktor 995 Hz oscillator on batteries at 2.3V RMS out)
Source to 725 only 2nd -141 dB 3rd -152 dB
Source to 725D only 2nd -138 dB 3rd -146 dB
Source to 725 & 725D (725 output) 2nd -129 dB 3nd -152 dB
Source to 725 & 725D (725D output) 2nd -140 dB 3nd -146 dB
Source to B&K 1607, 725 & 725D (725 output) 2nd -144 dB 3nd -146 dB
Source to B&K 1607, 725 & 725D (725D output) 2nd -136 dB 3nd -148 dB
Adding the B&K alters the source as does either of the analyzers. These are all way down in the mud and I need to use the highest resolution on the Wavetek to even see the harmonics in the analog output of the analyzers.
Good news for me is that the 725D seems to have a significant effect on the signal (if -140 dB is significant effect: .1 ppm). Now I know where to look for potential improvements, its the input amp and associated circuitry that's affecting things.
And this is why I won't just repeat the previous measurement, too much interacting data.
I believe the input capacitance of the different devices alters the phase of the harmonics just enough to change the mixed level when added to the internal harmonics of each device. I don't think there is enough info to extract the actual source harmonic levels from this yet.
Thank you.
It seems that I have to start a AK5394AVS project first now.
I got ATS-2 from audio precision, but the analyzer is not good enough to many projects of mine.
Thanks again.
I would hold out the for the AK5397 for now. You can get an EMU 1212m or EMU 1616m for pretty reasonable prices to hold you over and the implementation is good enough to outperform the ATS-2 if you fab some simple external probes etc.
I modified an EMU 1212M board changing the dual opamps to LME49720's and get the following from it. (.7V in at -10 dB "consumer" setting) I will be doing that for the 1616M as well. Probably not all the channels (6 in and 6 out) since it takes 5 duals for each stereo in and 3 duals for each stereo out.
Attachments
The deeper you go the more complex it all gets. . .
First, I set everything up to do the measurements simultaneously so any differences will be analyzer only. However this highlights the problems of measuring this way. Both the new and old Shibasoku analyzers impact the signal some. They both load the oscillators 600 Ohm output enough to change levels and when connected alter the source distortion some.
Here is a quick matrix (I can't connect the B&K 1607 output to an external device because the grounding and loading are affecting things- that's a pending to-do to deal with).
(Source is Viktor 995 Hz oscillator on batteries at 2.3V RMS out)
Source to 725 only 2nd -141 dB 3rd -152 dB
Source to 725D only 2nd -138 dB 3rd -146 dB
Source to 725 & 725D (725 output) 2nd -129 dB 3nd -152 dB
Source to 725 & 725D (725D output) 2nd -140 dB 3nd -146 dB
Source to B&K 1607, 725 & 725D (725 output) 2nd -144 dB 3nd -146 dB
Source to B&K 1607, 725 & 725D (725D output) 2nd -136 dB 3nd -148 dB
Adding the B&K alters the source as does either of the analyzers. These are all way down in the mud and I need to use the highest resolution on the Wavetek to even see the harmonics in the analog output of the analyzers.
Good news for me is that the 725D seems to have a significant effect on the signal (if -140 dB is significant effect: .1 ppm). Now I know where to look for potential improvements, its the input amp and associated circuitry that's affecting things.
And this is why I won't just repeat the previous measurement, too much interacting data.
I believe the input capacitance of the different devices alters the phase of the harmonics just enough to change the mixed level when added to the internal harmonics of each device. I don't think there is enough info to extract the actual source harmonic levels from this yet.
The 725D is pretty tight -- at its monitor output:
138 and 146
140 and 146
136 and 148dB
The 725 are:
141 and 152
129 and 152
144 and 146
THx-RNMarsh
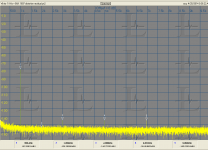
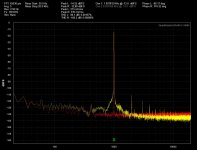
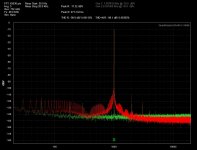
Victor 1k Oscillator into QA400 Win7 on OSX via Parallels
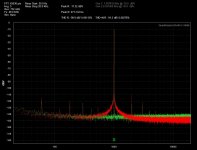
Yellow is the Victor 1k Oscillator
Red is the QA400 generator
In the 1st graph I was running 35.064VDC into the Victor oscillator for an hour.
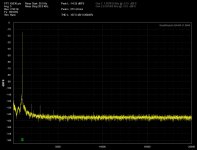
In the 2nd and 3rd graphs I adjusted the voltage down to 35.005VDC and left it running for an additional 30mins.
I'll try reducing the voltage further to see how it affects the graph.
Yellow is the Victor 1k Oscillator
Red is the QA400 generator
In the 1st graph I was running 35.064VDC into the Victor oscillator for an hour.
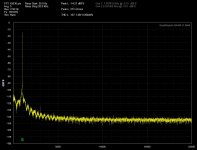
In the 2nd and 3rd graphs I adjusted the voltage down to 35.005VDC and left it running for an additional 30mins.
I'll try reducing the voltage further to see how it affects the graph.
Attachments
Yellow is the Victor 1k Oscillator
Red is the QA400 generator
In the 1st graph I was running 35.064VDC into the Victor oscillator for an hour.
In the 2nd and 3rd graphs I adjusted the voltage down to 35.005VDC and left it running for an additional 30mins.
I'll try reducing the voltage further to see how it affects the graph.
There is a lot noise in there particularly close in around the fundamental of Victor's oscillator. I have been unable to get a decent measurement of Victor's oscillator on the Emu 0204. The 0204 seems to be sensitive to the noise. I remember someone else commenting on the same, but I don't see this in Demian's measurements. So what's the difference? I ran Victor's oscillator(s), I have two, off four 9V batteries.
I'm running mine off of a Mastech linear PSU connected to a DMM to get more accurate VDC reading. It does seem to improve the longer it's powered on but the noise is more than I expected. The oscillator is inside an aluminum box. I'll have to try it on 4 9V batteries to compare. I forgot to mention that the noise seemed less at QA400's 48ksps than at 192ksps. I'll take a snapshot of it running at 48ksps.
Last edited:
I forgot to mention that the noise seemed less at QA400's 48ksps than at 192ksps. I'll take a snapshot of it running at 48ksps.
That's to be expected, The noise floor of 192ksps is higher.
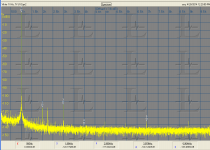
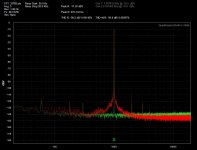
48ksps - 32768 pts / 5 avg
Red is the Victor Oscillator 1k on the Right channel
Green is a snap shot of the QA400 generator at 1k on the Right channel
What are others using for samples per second? 48 or 192ksps?
What are others using for pts? I'm using 16k or 32k, check out the upper left of the graphs.
What are others using for averaging? I'm using 5.
It makes sense that more information is displayed with the higher sample rates and data points. I uploaded 2 snapshots at different FFT pts.
I added a 3rd graph. It looks like the 65k pts plot settled down after a couple of minutes.
Attachments
Last edited:
Just thought I'd mention another observation I made when making the above measurements.....when I toggled the internal signal generator on/off the noise level changed. This was when I was measuring an external generator. When I flipped the QA400 signal generator on, the measured noise of the Victor oscillator increased. I made sure to have the QA400 signal generator turned off when I made the above measurements of the Victor. I can't recall if Demian made the same observation at some point in his QA400 thread.
- Home
- Design & Build
- Equipment & Tools
- Low-distortion Audio-range Oscillator