If you are looking at the nature of random noise why do you need such a huge dynamic range, or even the high sampling frequency? Maybe I don't fully understand the problem but it looks like the issue would be visible with a more limited capture setup if all the interesting parts are in the bottom 8 or less bits. I'm sure there are plenty of analysis packages that could make sense of the samples if we know what we want to learn from this.
Perhaps something as simple as a low level asynchronous pulse train (-80 dB, -100dB?) would be clear enough to show both the actual resolution of the individual pulses without averaging and the magnitude of the actual noise referenced to the pulses. If this is what the issue is.
Perhaps something as simple as a low level asynchronous pulse train (-80 dB, -100dB?) would be clear enough to show both the actual resolution of the individual pulses without averaging and the magnitude of the actual noise referenced to the pulses. If this is what the issue is.
Dear Pavel,
It seems that some may have misunderstood why I wrote this and decided to take it being meant as an insult.
I intended no sleight or insult, most people in this world do not speak english as native language.
English is MY third language and I found over the long years in England that I just would not "get" certain phrases or sentence constructs and hence misunderstand. Hence my intention to clarify.
Kind regards Thorsten
As English is not your first (or even second) language...
It seems that some may have misunderstood why I wrote this and decided to take it being meant as an insult.
I intended no sleight or insult, most people in this world do not speak english as native language.
English is MY third language and I found over the long years in England that I just would not "get" certain phrases or sentence constructs and hence misunderstand. Hence my intention to clarify.
Kind regards Thorsten
Hi,
FFT implies in theory (Fourier) an INFINITE timespan. We now have ways around this, however while FFT is a good tool for certain things, it is a poor tool for others.
First, the technical desription is contained in one word: "noiseshaping". Unlike the orthodox view (which uses the low noisefloor derived via FFT with massive averaging) I see it as a problem, rather than a solution...
The attached illustrates something that a suitable FFT would suggest is largely noise free and very low distortion. Yet looking at the output waveform with a 'scope directly makes clear that this is patently not the case... Any Amplifier or Speaker that produced an output like this would be classed as severely defective.
Ciao T
the full complex Fourier Transform of a time series is an exact Dual == contains all of the information from the time series - including the variation of each and every sample from noise, distortion, from any source
whether it makes certain phenomena more or less visible to the human eye/brain is the whole point of using both views: time and frequency domain
FFT implies in theory (Fourier) an INFINITE timespan. We now have ways around this, however while FFT is a good tool for certain things, it is a poor tool for others.
if the FFT isn't the "best" tool that doesn't mean you can get off with hand waving assertions - describe the signal, noise, distortion properties - in the time domain if that is easier
but without a definite technical description of the problem(s), measurable consequences you are simply not participating in a technical debate - just baiting
First, the technical desription is contained in one word: "noiseshaping". Unlike the orthodox view (which uses the low noisefloor derived via FFT with massive averaging) I see it as a problem, rather than a solution...
The attached illustrates something that a suitable FFT would suggest is largely noise free and very low distortion. Yet looking at the output waveform with a 'scope directly makes clear that this is patently not the case... Any Amplifier or Speaker that produced an output like this would be classed as severely defective.
Ciao T
Attachments
Luckily I can walk into Bob Adam's office and have him try to explain.
And did you indeed do this? I for one would be very interested indeed in his reply.
The attached illustrates something that a suitable FFT would suggest is largely noise free and very low distortion.
No, a suitable FFT (by which I mean where the sampling frequency is high enough not to cause aliasing) would indeed show noise, predominantly noise moved away (in the frequency domain) from the signal so it can be subsequently filtered.
Yet looking at the output waveform with a 'scope directly makes clear that this is patently not the case...
To be fair, looking at the output of a NOS (unfiltered) DAC would also look noise free, but its full of aliasing. So appearances are often somewhat misleading in the realm of digital signals.
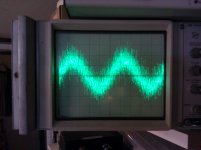
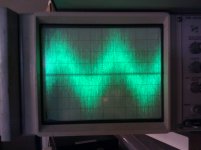
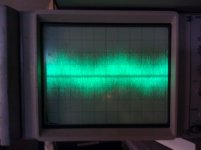
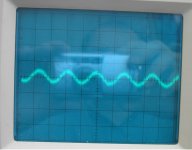
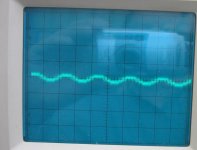
Here are three shots of a low level 1 KHz sine wave from a digital source (an AKM DAC in a sound card) running at 44.1 KHz. The level is -70 dB FS. The images are progressively wider bandwidth; 30 KHz, 80 KHz and 220 KHz. The noise dominates (the RMS level at 200 KHz is -58 dB FS) at the 220 KHz BW.
I don't have a quick way to insert different filters or weighting networks.
I'm not sure this invalidates the principles of delta sigma or if this really means anything. Even these images are "averaged" by the scope. It doesn't look pretty but to keep this in perspective try to capture a -70 dB sine wave from a turntable.
Attachments
so basically you're worried the reconstruction filter has to do some work?
all this time "averaging" in your posts has been a code word for the required analog reconstruction filter??
for DSD single bit the task is a little daunting for RC, op amp active filters - 3 rd order Multiple Feedback inverting filter up front is probably good if you want to stick with a classic filter alignment - otherwise pile on a few more high fc single pole RC up front
you want more filter stages but the 3rd order MF circuit up front would give better protection of the 1st op amp input from the AM radio band shaped noise - unfortunately the few direct DSD active filter circuits I've seen were Sallen-Key
for multibit noise shaping current output DAC the I/V converter does see a continuous dither/"noise" stream of several of the internal multibit DAC step size at the modulator frequency
I agree it is quite amazing that they make their datasheet numbers with 5534 op amps in some cases
Hawksford shows a multiloop op amp I/V circuit that I've never seen used - it seems everyone wants to build the "error correction" common base I/V from that paper
the ADA4898 has great specs for this I/V application - the linearized diff pair accepts up to 4 mV error with 120 dB gm linearity if I've worked the patent's math properly - and its fast 65 MHz GBW, with high output current for a op amp (40 mA "linear output current", 150 mA SC )
the question remains what sort of error exists in the output of noise shaped DAC reconstruction filters – and how to measure it – how it varies between bad and better implementations of the filter, I/V
Here are three shots of a low level 1 KHz sine wave from a digital source (an AKM DAC in a sound card) running at 44.1 KHz. The level is -70 dB FS. The images are progressively wider bandwidth; 30 KHz, 80 KHz and 220 KHz.
Do you know the slope of the filters? We can clearly see on the first that the dynamic range in 30kHz exceeds 70dB (because the signal is clearly larger than the noise), but we won't know by how much without knowing how steep the filters are.
Demian -
How was the bandwidth changed in your above mesurements?
Those are the low pass filters on my Boonton 1121 audio analyzer. I just spent an hour or so getting an antique B&K 1612 band pass filter with weighting networks running. I still have too much ground noise (60 Hz chassis to chassis leakage) to show the results but it seems the weighting networks do remove most of the grunge. I may try to clean up the setup in the morning to see if I can get better results.
It doesn't look pretty but to keep this in perspective try to capture a -70 dB sine wave from a turntable.
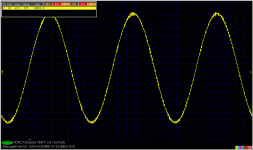
This is a -80dB FS dithered and not dithered sine from Marantz SA7001 in a CD mode.
Regarding single impulses, they can be captured by one-shot triggering.
The guys would be probably very surprised by time domain plots in SACD mode, though in frequency domain there is no problem to show -120dB signal, and after further amplification it is audible.
Attachments
Do you know the slope of the filters? We can clearly see on the first that the dynamic range in 30kHz exceeds 70dB (because the signal is clearly larger than the noise), but we won't know by how much without knowing how steep the filters are.
They are 3rd order Butterworth filters.
FWIW the DAC chip on the card is an AK4358 http://www.asahi-kasei.co.jp/akm/en/product/ak4358/ak4358_f01e.pdf not a super grade chip. I may substitute a premium DAC tomorrow if I can squeeze in the time.

PMA, I meant an analog turntable, not a CD turntable.
Why is the dithered signal stronger?
Yes I know, I know the plots, but have no snapshots. Just wanted to show lov-level CD sine in time domain, as frequency domain is not appreciated by some.
The dithered signal is stronger for the reason that it adds peaks that were cut by quantization. Scope image is naturally averaged.
Last edited:
ust wanted to show lov-level CD sine in time domain, as frequency domain is not appreciated by some.
Curious to think that you might have that impression of me, that I don't appreciate the frequency domain

What would be much more interesting than sine tests would be tone bursts. Then follow with an analysis which has a wide dynamic range - not a scope which struggles to show something at least 40dB down.
Ever done any wavelet analysis?
SY played some live music recordings through a $29 USB to SPDIF dongle (not even in an enclosure) for me last night. Why there is still a business in $12,000 DAC's, etc. is beyond me.
After you left, we played the recordings made tonight through it- I hate to use the cliche, but my wife, who doesn't care about sound, immediately and spontaneously commented that it was the most realistic sound she's ever heard from a hifi. What got her attention was the sound of the applause. She's VERY impressed with your mikes.
But maybe it's all because of my crummy speakers.
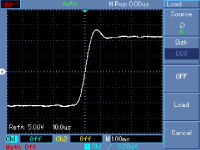
Interesting that only CD mode is using a linear phase filter, SACD mode looks to be min-phase.
I assume that SACD (DSD noise filter) uses 3-pole Butterworth. It is an analog filter, and according to recommendations it has cut off frequency near 50kHz.
Regarding frequency domain, I certainly did not mean you
Never done any wavelet analysis, though I am interested in it.
SACD rise time attached.
Attachments
Last edited:
- Status
- Not open for further replies.
- Home
- Member Areas
- The Lounge
- John Curl's Blowtorch preamplifier part II