Ran an open loop & closed loop set up & lead calibration test just a few days ago.
Have tried different arrangements but usually don't have leads close & parallel while calibrating because it is not always possible while testing - but thx for the reminder.
Ls Cs & Rs are three different functions with the option of a selectable secondary function displayed also.
So Rs results I showed were not piggy backed on an Ls result.
If Rs is lower than DCR I have been ignoring it.
Ah, ok. I'd do the same.Ran an open loop & closed loop set up & lead calibration test just a few days ago.
Have tried different arrangements but usually don't have leads close & parallel while calibrating because it is not always possible while testing - but thx for the reminder.
Ls Cs & Rs are three different functions with the option of a selectable secondary function displayed also.
So Rs results I showed were not piggy backed on an Ls result.
If Rs is lower than DCR I have been ignoring it.
jn
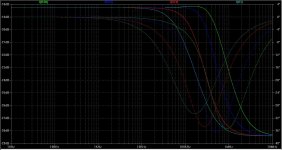
I just put two graphs in a new personal gallery, showing how some inductors in the 200-300uH range react both in air and against a copper PCB plane. It's interesting to see how nearby conductive surfaces change both the losses and the overall inductance. Something to be aware of should you be using air core coils and need exact values.
jn
jn
When I think about an environment to get the best from inductors, I think of this guy
Lion talks about Space Age - YouTube
Lion talks about Space Age - YouTube
There are a few things about my LCR meter that are a bit weird:
DCR = 0.03
1 khz Ls 1.2uH, Rs 0.005
10khz Ls 1.24uH Rs 0.009
100khz Ls 1.157uH Rs 0.029
Seems to more confused at 1khz & 10khz
Doesnt the inductance gets higher on an aircore the lower the freq and decreases as you go up ...
I just put two graphs in a new personal gallery,
jn
Jn
Thanks again. In this diagram:
with the inductors close to copper, R increases linearly with frequency from 2kHz and up.
With the inductors in free air, from 9kHz to 50kHz, R increases faster with frequency and from 50kHz and above the rate droops.
I would expect the opposite, a linear increase of R with cores on air and a nonlinear increase with cores close to copper plate due to the extra eddy currents in the copper.
Where is my fault?
George
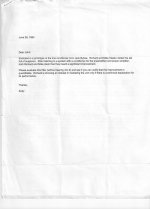
Sorting out some technical papers, I found this 'very beginning' of my association with Jack Bybee and his 'products'. It has been a long strange trip that I still enjoy.
Tsk, tsk. A dear John letter...
I get those too...
Have a nice holiday John..
John
Jn
Thanks again. In this diagram:
with the inductors close to copper, R increases linearly with frequency from 2kHz and up.
With the inductors in free air, from 9kHz to 50kHz, R increases faster with frequency and from 50kHz and above the rate droops.
I would expect the opposite, a linear increase of R with cores on air and a nonlinear increase with cores close to copper plate due to the extra eddy currents in the copper.
Where is my fault?
George
Your fault?? None.
I've no idea how to analytically model it. Remember, as the eddies fight the rate of change, it excludes field. If the conductor were inside the winds where field lines were forced, it'll act differently. Exclusion of the field would reduce the losses.
The meter lumps eddy current losses and IR losses into Rs by it's nature of calculations. I assume it does an rms calculation of the powers that are in phase and 90 degrees out. As long as we don't try to extend too far into the high dissipation area, I guess we can use simple models. But if we try to extrapolate too far, we'll probably leave reality.
Bottom line, I'm just the messenger here. One of the guys here could certainly develop an analytical model that'll be accurate to ten decimal places. But I'm also confident I won't be able to follow it past the first half page of equations.
jn
Oh, your employer contacts you by e-mail on occasion?
Nah.
And they avoid eye contact as well...go figure.
jn
I once had a friend that work in a small store with 5 employees . His boss would walk by him to put a memo in his mail box rather than speak to him.Nah.
And they avoid eye contact as well...go figure.
jn
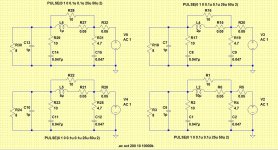
Dan,
Do you want 8ohm load ?
What choke values you want ? 2uH, 5uH, 10uH ok ?
Thanks Mike.Dan
Is this what you wanted ?
I was/am interested as per recent discussion to see effects with differing loads.
Also discussion of advantages or not of this network, as opposed to standard output circuit.
Dan.
I once had a friend that work in a small store with 5 employees . His boss would walk by him to put a memo in his mail box rather than speak to him.
Holy mackerel. That is exactly how it was in a place I worked 22 years ago. The boss was pretty "different". Not bad, just different.
jn
I can send you the excel data if you wish.jn
Can you construct plots with the equivalent series resistance vs frequency and the dissipation factor vs frequency for these coils?
George
Or I can play excel tomorrow.
jn
- Status
- Not open for further replies.
- Home
- Member Areas
- The Lounge
- John Curl's Blowtorch preamplifier part II