great people to get levelheaded feedback from, from time to time
Not intended to pass judgements, I've made money in everything from the fashion garment industry to digging holes, and everything in life and technology is a compromise.
(Bit of a prostitute, I try to adapt to whichever situation/person, and locate the proper and most efficient tool for the job. If one fails, try another. Also leave the gate open in winter to sniff deer nose, but closed in summer due to living in a Tick & Lyme hazardous area)
qusp,
Yes a friend has the Bruel and Kjaer turntable in his lab and that not only turns up to about 300 lbs of speaker but also is interfaced with the graphing so you know the angular position on the response plot. He actually found his on Ebay of all places but already had a complete B&K lab worth of equipment. Getting the strip chart of software to interface with the positioning of the turntable is the trick.
Yes a friend has the Bruel and Kjaer turntable in his lab and that not only turns up to about 300 lbs of speaker but also is interfaced with the graphing so you know the angular position on the response plot. He actually found his on Ebay of all places but already had a complete B&K lab worth of equipment. Getting the strip chart of software to interface with the positioning of the turntable is the trick.
Are you sure that's what you want to measure? The absence of "bad" electrons in the output would be what you want isn't it? You know, the ones the demon grabs in passing.
OTOH what you are presenting to the system is a signal how could it tell what to remove?
A better way to do it would be to mix the signal with a noise source, and then compare the output with the signal subtracted between straight wire and Byebee.
Obviously, the noise has to be completely random, so it cannot be generated in any computerized device. This is because if you know the seed and the algorithm, the noise becomes determined, which effectively turns it into a signal. This will confuse the Beebye.
Therefore, you need to mix in a noise that is truly generated in a random way, e.g. by using a Wavac single ended amp as a noise generator.
This would also award the kind of high end cachet and dignity to the test which the Byebye deserves.
If the bad electrons have to do more work at the filter then they tend not to be as active later.
Yes everything is a signal the question is do the demons know the other team's playbook?
You are proving that anything can be proven if the methodology and the results are obfuscated enough.
You are proving that anything can be proven if the methodology and the results are obfuscated enough.
And what is it about the test setup you don't understand?
Talk to Carl Haber. He would know if anyone's doing it commercially.
Home Page
see .PDFs halfway down the page
Home Page
see .PDFs halfway down the page
OK I have been asked who can scan this record to replay it. It is not longer able to track a stylus.
https://dl.dropboxusercontent.com/u/76324/Eldridge 99.jpeg
And what is it about the test setup you don't understand?
How a mite gets to the beehive.
Oh yeah... BY BEE!
---
But maybe the demon doesn't remove any noise. That would seem to be out of character for a demon, anyway. Maybe the demon just creates some noise that he sends backwards, out of the input, so that when you measure the output versus the input it looks like a reduction.
Talk to Carl Haber. He would know if anyone's doing it commercially.
Home Page
see .PDFs halfway down the page
Or find someone with a Finial/ELP Laser Turntable The Laser Turntable | Steve Hoffman Music Forums http://www.elpj.com/ It would be a project to recover the audio from that disk to say the least.
Last edited:
Now that is what I call thinking out of the box!gootee said:But maybe the demon doesn't remove any noise. That would seem to be out of character for a demon, anyway. Maybe the demon just creates some noise that he sends backwards, out of the input, so that when you measure the output versus the input it looks like a reduction.
Therefore, you need to mix in a noise that is truly generated in a random way, e.g. by using a Wavac single ended amp as a noise generator.
Here is a proposal. Create a pseudo-random 1/f noise-like signal that you can recapture at the output by the inverse algorithm and then run it through the filter mixed with real random 1/f noise from a lousy amplifier or filtered zener noise, etc. Only your signal should come out. This might be too scientific, set something up with an expected result and that's what you get.
Last edited:
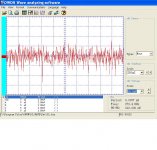
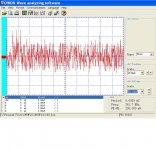
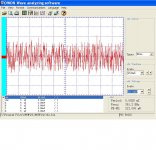
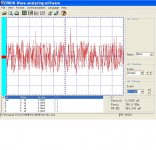
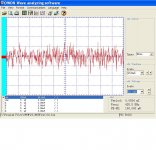
Well I slowed down the sweep speed, lowered the level and used a transformer to isolate the signal across the device under test.
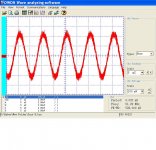
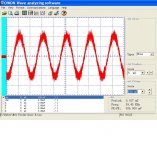
Here are some of the results. It is easy to see the difference between the Bybee and a resistor of the same value. (+/- 5%).
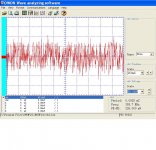
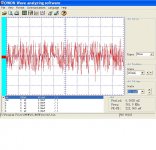
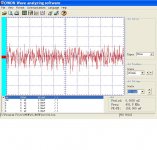
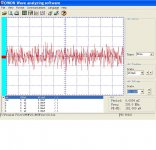
First five are the resistor the second five are the Bybee.
All this proves to me is that you can tell the difference between a resistor and a Bybee. Peak to peak voltage averages 176 mV vs 226 mV for the Bybee.
I have on order more .025 ohm resistors of different types. If those change things I'll post more pictures.
ES
Here are some of the results. It is easy to see the difference between the Bybee and a resistor of the same value. (+/- 5%).
First five are the resistor the second five are the Bybee.
All this proves to me is that you can tell the difference between a resistor and a Bybee. Peak to peak voltage averages 176 mV vs 226 mV for the Bybee.
I have on order more .025 ohm resistors of different types. If those change things I'll post more pictures.
ES
Attachments

Last edited:
Well I slowed down the sweep speed, lowered the level and used a transformer to isolate the signal across the device under test.
ES
Your noise is still indistinguishable from desired signal and you are not testing the claims. If those waveforms were the low frequency content of a piece of music they should be the same.
EDIT - I tried to read "Want is Quantum Purification" again, it's such nonsense there is no identifiable claim, you can leave me out of this silliness.
What is so amazing? Different Ls and different Rs.Scott, JN, Demian, Pavel etc.,
Here is the amazing part the traces using the same setup filter included but sourcing a sine wave with noise.
Remember, Ls and Rs vary with frequency. Rs is a composite of element resistance and eddy losses. Ls is a composite of element inductance and lenz exclusion.
And your meter doesn't have the resolution to see it distinctly.
Sweep a sine while doing a differential measurement between the bybee and the resistor.
jn
Your noise is still indistinguishable from desired signal and you are not testing the claims. If those waveforms were the low frequency content of a piece of music they should be the same.
EDIT - I tried to read "Want is Quantum Purification" again, it's such nonsense there is no identifiable claim, you can leave me out of this silliness.
Want is?
I think your problem is that you aren't laughing enough!
JN,
The inductance is not that different, and low enough not to matter for the 160 Hz low passed (12 db Butterworth) noise and test signals. The sine wave stays very close from 20 to 180 Hz. (Say 5% P-P)
I looked at the baseline noise in my system from the power amplifier etc, and set my noise level above that and then ran the measurements for noise and then repeated the process for sine waves. I have done about 100 data runs.
I have no clue why the results are what they are. They are interesting.
I'll let it sit for a bit and perhaps try something close but different.
ES
Sweep a sine.
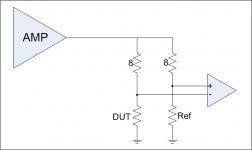
Oh, and don't forget symmetry. The ground return current should be physically between the dut and ref, then physically between the two 8 ohm resistors, where you should use coax to get from the resistor pair to the amp to exclude external field from the drive wire. The vtap pickups to the IA should be tight twisted pair. Make sure the IA has sufficient CMRR for the frequencies of interest.
And Ed, your seeing vdrop across the bybee. It's either L, R, or a combination. Use a real test setup to determine the mag and phase of the difference vs frequency.
I will tell you up front, you are not going to be able to measure resistive difference at that value vs frequency. You can't control your test setup enough to do so. That is a big caveat to low impedance measurements..everybody gets bit by that. The only thing you can do is use the test setup I show. If you can get the setup to work well enough, we can discuss using two tone, what can happen in the non linear realm, and what it means.
jn
Attachments
Last edited:
JN
When I get a chance I'll do the bridge setup into the AP and compare the Bybee to a straight resistor with the same R & L as shown on my GR test bridge.
I'll also FFT my noise source after the LPF.
My calibrator has been a straight wire. It does read lower noise than the R or B. Like I said the results are interesting. The B does seem to be a bit different than my reference resistor. That is why I may try a few more types.
JN
When I get a chance I'll do the bridge setup into the AP and compare the Bybee to a straight resistor with the same R & L as shown on my GR test bridge.
I'll also FFT my noise source after the LPF.
My calibrator has been a straight wire. It does read lower noise than the R or B. Like I said the results are interesting. The B does seem to be a bit different than my reference resistor. That is why I may try a few more types.
You will not get correct results with the AP if the loss mechanism is rate of change dependent as eddy dissipation is. While the differential with sine plus noise is interesting, you most likely will not be able to develop an analytical relationship to describe the difference. That means that the chances are great that you will come to incorrect conclusions.
That is why I recommended sine first.
jn
- Status
- Not open for further replies.
- Home
- Member Areas
- The Lounge
- John Curl's Blowtorch preamplifier part II