Hi all,Yes, that is why I mentioned that it seems very circuit specific. 99 times out of a hundred it does work... trouble is, I don't know why it works as it does.
This is turning out to be an excellent resource for my LTspice learning curve. Thank You!
I am, in parallel, learning the ins and outs of Multism. Would anyone have an objection to starting a Multisim thread as a resource for learning Multisim? [emoji4]
Chris Juried
Audio Engineering Society (AES) Member**
http://www.JuriedEngineering.com
http://www.TubeEquipment.com
http://www.Historyofrecording.com
Last edited:
Thanks for the kind words
Yes by all means start a parallel Multisim thread. I'm sure that many would find it useful.
My pleasure. Thank you for expanding our LTspice world. I'll start the thread and do hope the DIY world finds it educational and useful.
...........I'll start the thread and do hope the DIY world finds it educational and useful.
I'm sure that they will, no doubt about that.
I've been asked how to show the power supply rejection of a typical amplifier and the following attached folder shows typical settings and values for a simulation. If you run the sim, have a look at the rails and how the rails are configured, and then look at the output of the amplifier. You could then take this ripple value in conjunction with the full achievable output of the amp and try and come to some reasonable figure for the PSRR.
Edit... 24th April 2017
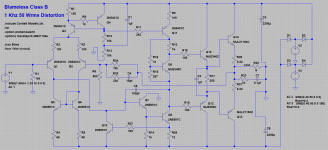
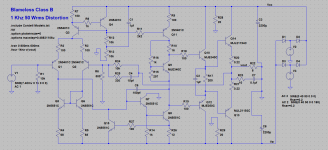
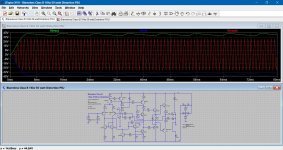
Using a more realistic PSU. Here we have the classic blameless topology of amplifier with a PSU consisting of two AC voltage sources feeding a bridge. The reservoir caps are standard library models with e.s.r. included.
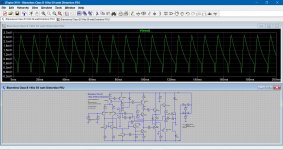
The first image shows the amplifier set up together with a 'Transient Analysis' run in the second image. Here we can clearly observe the PSU start up behaviour and ripple on the rails.
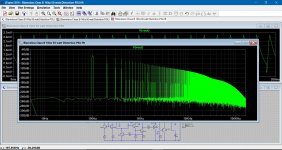
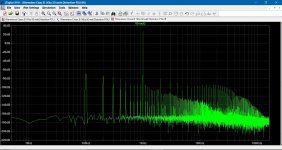
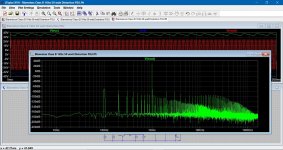
The amplifier has been set to develop its rated 50 wrms into 8 ohms and the resulting current draw of this clearly introduces ripple onto the rails. The third and fourth images shows the FFT plot of the amplifier output and here it can be seen that there is a considerable 100Hz (and harmonics) component being introduced into the output.
All the FFT values are referred to the amplifier input (1.33 volt peak which delivers 28 volts peak at the amplifier output). This translates to +26db for the 1kHz fundamental and -69 db for the 100Hz PSU fundamental.
We can also do something different and set amplifier to have no input signal. Next we add a load to each rail, say 20 ohms, to introduce some ripple. The last three images show this with the final image being the test set up. The input has been set to zero amplitude and two 20 ohm resistors added.
Now we just look at the amplifier output and see what makes it through.
Edit... 24th April 2017
Using a more realistic PSU. Here we have the classic blameless topology of amplifier with a PSU consisting of two AC voltage sources feeding a bridge. The reservoir caps are standard library models with e.s.r. included.
The first image shows the amplifier set up together with a 'Transient Analysis' run in the second image. Here we can clearly observe the PSU start up behaviour and ripple on the rails.
The amplifier has been set to develop its rated 50 wrms into 8 ohms and the resulting current draw of this clearly introduces ripple onto the rails. The third and fourth images shows the FFT plot of the amplifier output and here it can be seen that there is a considerable 100Hz (and harmonics) component being introduced into the output.
All the FFT values are referred to the amplifier input (1.33 volt peak which delivers 28 volts peak at the amplifier output). This translates to +26db for the 1kHz fundamental and -69 db for the 100Hz PSU fundamental.
We can also do something different and set amplifier to have no input signal. Next we add a load to each rail, say 20 ohms, to introduce some ripple. The last three images show this with the final image being the test set up. The input has been set to zero amplitude and two 20 ohm resistors added.
Now we just look at the amplifier output and see what makes it through.
Attachments
-
M1 Ripple Rejection.zip6.1 KB · Views: 105
-
 PSRR 1.png65.5 KB · Views: 146
 -
Blameless Class B 1Khz 50 watt Distortion PSU.zip6.7 KB · Views: 89
-
 PSRR 7.png61.2 KB · Views: 104
 -
 PSRR 6.JPG297.5 KB · Views: 94
 -
 PSRR 5.JPG295.6 KB · Views: 139
 -
 PSRR 4.JPG246.3 KB · Views: 132
 -
 PSRR 3.JPG313.2 KB · Views: 139
 -
 PSRR 2.JPG317.7 KB · Views: 139
This is a revised version where the supplies have been replaced by AC voltage sources plus bridge and reservoir caps.
You can try altering the reservoir cap sizes and also increasing R10 so that the amp draws more quiescent current in the output stage.
The simulation time is set for 20 seconds with sampling of the last 100ms but even so the sim takes only a few seconds to complete. This amp has a DC servo and you can examine the operation of that as well. If you change the simulation 'Transient' time to run for just 2 seconds then you will see the servo action appear as a damped oscillation at the output.
Attachments
Absolutely intriguing - I was about to go on the offensive for the purist Hi Fi enthusiast, when I realized what you were on about - it's truly impressive, and an ingenious use for PC's - I get so fed up with the simulators and synthesizers, and even got fed up with my new car, because I had to learn it.
Not a dinosaur, just a purist.
Congrats - good program, and I would recommend Linux to those who haven't tried it.
Dave.
Not a dinosaur, just a purist.
Congrats - good program, and I would recommend Linux to those who haven't tried it.
Dave.
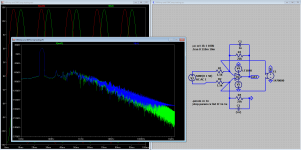
I have been asked by another member whether its possible to plot an FFT from a waveform showing a differential voltage.
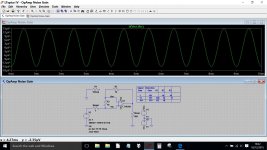
I have a simple opamp circuit that seemed a likely candidate to try this on. I've labelled the opamp inputs Vin+ and Vin-. When the sim is run we can left click the + input and place one 'scope probe' on that spot and then still holding the left mouse button move to the - input and place another probe. That gives us a plot of the differential voltage as can be seen.
How (is it even possible) do we show the FFT of that voltage ?
Attachments
in 1st the fft popup window you <ctrl>+click to select all the needed node V, and/or branch currents, they get highlighted as you click them
after clicking OK the next "Select Visible Waveforms to Plot" window allows you to <alt>+double click a waveform label in the list you previously highlighted to enter a equation editor
you can only use the previously highlighted waveforms in your equation using the fft of each waveform
it places the <alt>+double click waveform def in the editor window, but have to enter the rest yourself
you can get to the same equation editor by just clicking the waveform label at the top of the fft plot - but if it involves other waveforms you still have to have highlighted all the needed waveforms in the fft window at the 1st step
Last edited:


 that's thanks to jcx
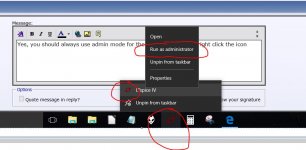
 When I went to check for LTSpice updates, I got the message that I need to restart it and run it as an Administrator. How do I do that? I never had to choose Administrator or otherwise when I first installed it months ago. Did I miss something?
The PC is a home desktop that's mine alone and was not set up with any special Administrator/user permissions and I've never run into this with any other software. Any ideas?
The PC is a home desktop that's mine alone and was not set up with any special Administrator/user permissions and I've never run into this with any other software. Any ideas?
I have been asked by another member whether its possible to plot an FFT from a waveform showing a differential voltage.
I have a simple opamp circuit that seemed a likely candidate to try this on. I've labelled the opamp inputs Vin+ and Vin-. When the sim is run we can left click the + input and place one 'scope probe' on that spot and then still holding the left mouse button move to the - input and place another probe. That gives us a plot of the differential voltage as can be seen.
How (is it even possible) do we show the FFT of that voltage ?
Use a voltage controlled voltage source, connect the inputs between any two points you like, connect the - output to ground, and take the FFT from the + output, that should work (I think)
")
Use a voltage controlled voltage source, connect the inputs between any two points you like, connect the - output to ground, and take the FFT from the + output, that should work (I think)
Here, more than a 1000 words to go with that
Attachments
< LTSpice simulation command DC sweep for resistors>
Submitted as an idea/tutorial. Original post taken from First watt F7......
**************************************************************
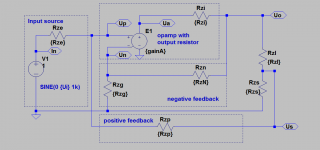
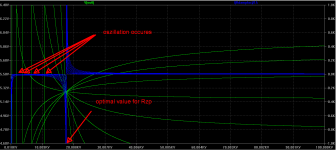
Here is an easy way to simulate the correct value of the positive feedback resistor Rzp. Schematic in post #218 was transfered into a generalized form, given in Mitkopplung20151230g0.png, which is largely expanded in the asc file, see below.
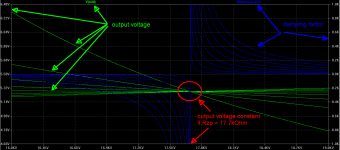
In Mitkopplung20151230g.png a simulation result is shown.
While most of the values of the resistors are given by practical reasons, especially the influence of Rzp and the load RzL are critical on the damping factor and the output voltage. Thus and to keep simulation effort low, different combinations of the 2 resistors shall be simulated in one go. But in LTSpice simulation command DC sweep only active sources can be specified and not resistors. To solve that problem the load resistor and the positive feedback resistor Rzp are replaced in the simulation each by a controllable current source. (Idea: At a given voltage a resistor determins the current according to Ohms law. So a resitor can be replaced by a current source which current is determined by the voltage dived by the resistance, which value is specified by an active source.)
Please notice that as a result the value of Rzp is given on the horizontal axis as kilovolts but is of course in kOhm.
The zip file contains the asc file with explanation and 2 plot files.
To zoom out the simulation result, the command
.dc VTunableResistor1 16000 19000 1 VTunableResistor2 1 8 1
needs to be changed for example into
.dc VTunableResistor1 10 100k 10 VTunableResistor2 1 8 1
Mitkopplung20151230g1.png shows the result.
Submitted as an idea/tutorial. Original post taken from First watt F7......
**************************************************************
Here is an easy way to simulate the correct value of the positive feedback resistor Rzp. Schematic in post #218 was transfered into a generalized form, given in Mitkopplung20151230g0.png, which is largely expanded in the asc file, see below.
In Mitkopplung20151230g.png a simulation result is shown.
While most of the values of the resistors are given by practical reasons, especially the influence of Rzp and the load RzL are critical on the damping factor and the output voltage. Thus and to keep simulation effort low, different combinations of the 2 resistors shall be simulated in one go. But in LTSpice simulation command DC sweep only active sources can be specified and not resistors. To solve that problem the load resistor and the positive feedback resistor Rzp are replaced in the simulation each by a controllable current source. (Idea: At a given voltage a resistor determins the current according to Ohms law. So a resitor can be replaced by a current source which current is determined by the voltage dived by the resistance, which value is specified by an active source.)
Please notice that as a result the value of Rzp is given on the horizontal axis as kilovolts but is of course in kOhm.
The zip file contains the asc file with explanation and 2 plot files.
To zoom out the simulation result, the command
.dc VTunableResistor1 16000 19000 1 VTunableResistor2 1 8 1
needs to be changed for example into
.dc VTunableResistor1 10 100k 10 VTunableResistor2 1 8 1
Mitkopplung20151230g1.png shows the result.
Attachments
- Home
- Design & Build
- Software Tools
- Installing and using LTspice IV (now including LTXVII), From beginner to advanced