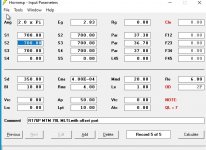
So another question -- how do I specify the diameter, length and offset of the port?
port surface (you can calculate the diameter from that): Ap
port lengh: Lpt
offset of port is L23 (lenght between S2 and S3)
if you are looking how diameter, lenght and offset impact the response/impedance .... use the loudspeaker wizard to immediately see results of your changes!
use the loudspeaker wizard to immediately see results of your changes!
That's basically the only window I am using anyway

port surface (you can calculate the diameter from that): Ap
port lengh: Lpt
offset of port is L23 (lenght between S2 and S3)
if you are looking how diameter, lenght and offset impact the response/impedance .... use the loudspeaker wizard to immediately see results of your changes!
Thanks stv!
Why in horn resp (in my 230l sealed box);
If I go from one driver to 2 in series HF sensitivity improves, If I continue to add woofers in series Hf starts to suffer...
If I go one driver to 2 in parallel and the whole FR sensitivity jumps up
2 in series should dbl inductance and thus lower Hf sensitivity youd think
If I go from one driver to 2 in series HF sensitivity improves, If I continue to add woofers in series Hf starts to suffer...
If I go one driver to 2 in parallel and the whole FR sensitivity jumps up
2 in series should dbl inductance and thus lower Hf sensitivity youd think
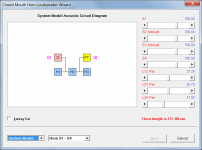
the schematic appears to show a port, but I don't think it's actually connected to Segment 3
When in doubt, check the system model acoustic circuit diagram to clarify.
Attachments
Why in horn resp (in my 230l sealed box);
If I go from one driver to 2 in series HF sensitivity improves, If I continue to add woofers in series Hf starts to suffer...
If I go one driver to 2 in parallel and the whole FR sensitivity jumps up
2 in series should dbl inductance and thus lower Hf sensitivity youd think
Discussed here: https://www.diyaudio.com/forums/mul...m-spl-low-distortion-2-a-908.html#post6863352
That depends on what you are trying to cover. And your desired SPL. And how close you are to your speakers. Headphones do this marvelously. BUt for anything looking to crack 100db at a few meteres I's say no. Unless you are only interested in the human voice range. Bass reproduction requires a very different set of parameters to be done correctly than does the midrange or high frequency sections.
Hornresp Update 5320-211204
Hi Everyone,
BUG FIX
When multiple drivers were specified using the loudspeaker wizard sliders, the results for direct radiating systems could sometimes be incorrect. The post linked below refers.
https://www.diyaudio.com/forums/mul...m-spl-low-distortion-2-a-909.html#post6863895
This bug has now been fixed.
Kind regards,
David
I was trying to help out otswim in the Full range forum, who is trying to design an MLTL for a Dynavox LY302F 3-1/2" driver.
Anyway, tried modelling identical geometries using the Mass Loaded Transmission Line and Offset Port Transmission Line modules. But the Acoustic Power results are a bit different. can you tell me why?
I did manually adjust the path length for the MLTL version to match the path length in the Offset Port version.
The two results are attached. First is the ML version, scond is the OP version. Both Acoustic Power plots and text records are attached.
The difference between the Power plots seems like there's some stuffing in the OP version that's not in the ML version. But I didn't add stuffing to either yet, at least not on purpose.
Why are they different?
Thanks,
Eric
Attachments
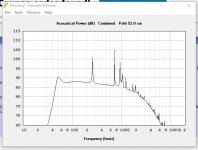
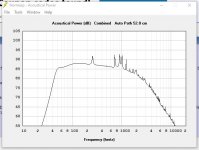
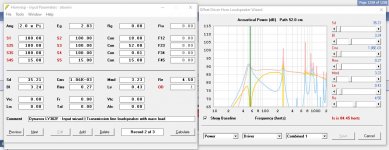
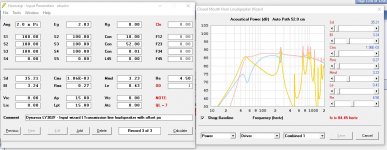
And here are the combined power plots with the corresponding input pages:
You’ve got the adjustable Q maxed out at ‘7’ in one and lossless in the other .
Switch the close mouth port to exit versions option to Lossless by by clicking the window/symbol in the lower right hand corner
Here are the the Acoustic Power plots for the ML and OP versions in my previous post. Again, I think they should be virtually identical, but they are not Why?
Hi Eric,
The OP model automatically adds an internal end correction to Lpt. Move the mouse pointer over the Lpt input box to display the end correction value in the status bar panel at the bottom of the window (for your design the value is 1.34 cm). The OP model also automatically sets quality factor QL = 7, as Booger weldz has pointed out.
To make the results of your two designs identical, add the end correction of 1.34 cm to L45 in your ML design, so that L45 = 16.34 cm, and double-click on QL = 7 in your OP design in edit mode and move the QL slider to maximum (lossless).
Kind regards,
David
What am I missing?Eric
The OP model also automatically sets quality factor QL = 7, as Booger weldz has pointed out.
hi eric,
also see david's response (12555) to my similar question:
https://www.diyaudio.com/forums/subwoofers/119854-hornresp-1256.html#post6860617
- Home
- Loudspeakers
- Subwoofers
- Hornresp