Hello Elias,
-25 dB ( = 5%) is not what can be called a strong reflection.
If the pale blue artifact you indicated at 1ms is due to a reflection this means that the reflector is at a distance of 34/2 = 17cm from the diaphragm.
This is exactly the double distance between the diaphragm of the TD2001 and the throat of the horn. This is a double refelection. (there is may be also on you wavelet graph a 0.5ms artifact corresponding to a single reflection between diaphragm and throat).
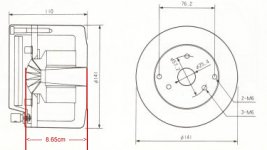
You'll find in attached file a schematic of the TD2001 showing the 8.5cm distance from diaphragm to throat.
The presence of a reflection at 1ms significates also that my measured Jerzual 321horn built by Marco Henry, is not perfectly fitted to the TD2001. The angle at throat of the horn is probably a bit different of the output angle of the driver. This can surely be improved as Martin Seddon does on its Azura Horns.
See also for that page from the TAD catalog:
http://img154.imageshack.us/img154/2537/tadcatalog8rz5.jpg
Best regards from Paris, France
Jean-Michel Le Cléac'h
-25 dB ( = 5%) is not what can be called a strong reflection.
If the pale blue artifact you indicated at 1ms is due to a reflection this means that the reflector is at a distance of 34/2 = 17cm from the diaphragm.
This is exactly the double distance between the diaphragm of the TD2001 and the throat of the horn. This is a double refelection. (there is may be also on you wavelet graph a 0.5ms artifact corresponding to a single reflection between diaphragm and throat).
You'll find in attached file a schematic of the TD2001 showing the 8.5cm distance from diaphragm to throat.
The presence of a reflection at 1ms significates also that my measured Jerzual 321horn built by Marco Henry, is not perfectly fitted to the TD2001. The angle at throat of the horn is probably a bit different of the output angle of the driver. This can surely be improved as Martin Seddon does on its Azura Horns.
See also for that page from the TAD catalog:
http://img154.imageshack.us/img154/2537/tadcatalog8rz5.jpg
Best regards from Paris, France
Jean-Michel Le Cléac'h
I mean the reflections/diffractions as indicated here:
An externally hosted image should be here but it was not working when we last tested it.
There is strong reflections/diffractions at 1ms and 2ms. The Hornresp does not give a clue about those. You say the reason is TAD driver conical part, but as 1ms corresponds to 34cm and 2ms 70cm and these delays are quite large, is it right? What are the dimensions of the TAD TD2001 conical part?
Attachments
Last edited:
Good deal.
I hope that we can establish parameters for the charts we post. It will at least give us common ground. Until then, it's all a mis-mash.
I do agree that we should keep an open mind and use other techniques, but let's at least start from a common ground. Lets all show measurements done in the same way.
Maybe only by measuring and comparing horns and waveguides that are said to honk with those that do not, will we find it. Is honk reflections? Group delay, frequency response, something else?
I have some more measurements to post from yesterday. Sorry, I don't have a good way to test the horns outside, too much traffic noise. I think that impedance plots can show useful info - see mine posted earlier.
I hope that we can establish parameters for the charts we post. It will at least give us common ground. Until then, it's all a mis-mash.
- How far down do we need to look? 30dB? 40dB? "Honk" is not that subtle, is it?
- Time slice. Important! How far before and after the impulse peak do we need to look?
- Other than time and level, anything else?
I do agree that we should keep an open mind and use other techniques, but let's at least start from a common ground. Lets all show measurements done in the same way.
Maybe only by measuring and comparing horns and waveguides that are said to honk with those that do not, will we find it. Is honk reflections? Group delay, frequency response, something else?
I have some more measurements to post from yesterday. Sorry, I don't have a good way to test the horns outside, too much traffic noise. I think that impedance plots can show useful info - see mine posted earlier.
How far down do we need to look? 30dB? 40dB? "Honk" is not that subtle, is it?
That's a good question. I am with Earl that audibility seems to be level dependent. If that's true and it's vissible in any of these measurements we should see a clear trend as the SPL increases.
Time slice. Important! How far before and after the impulse peak do we need to look?
What's there to see before the impulse?? If we gate beyond the first reflection the measurements will be contaminated with room artifacts.
Other than time and level, anything else?
We use these horns in systems. We should also be looking at them as they would be normally be used. Not at just the horns alone
Rob
")
I've started testing at about 97dB. If it's there, it should be there at 97dB. And if Geddes is right that it's subjectively level dependent, then we should be able to "see" it at any level, right? But not hear it at low levels.If that's true and it's vissible in any of these measurements we should see a clear trend as the SPL increases.
Nothing, as far as I know. But maybe we need to decide how wide the impulse is. Looking at impulses of ideal high pass filters, I don't see anything farther than a few samples before the peak. I've been gating 48 samples before (1 millisecond).What's there to see before the impulse??
I'm torn between using them as we normally do and isolating them from outside influences. I can see the merits of both.
Hello Elias,
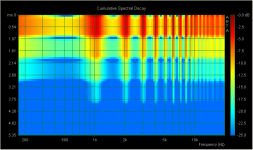
May be not the best but a normal CSD for that series of pulses separated by 1 ms will looks as in the attached graph.
As I said previously wavelets have a strong tendancy to favor the temporal aspect of the signal. (Specially with such a "thin" wavelet as you are using). Also - as it is perfectly seen in your example- we loose all temporal prcision at low frequency (we don't see anything below 1kHz in you wavelets graph).
With the CSD we can obtain a (IMHO better) balance between the temporal effect (the time series of pulses) and their comb filtering effect better illustrated in the frequency domain. Below 500Hz we can still separate the pulses...
Best regards from Paris, France
Jean-Michel Le Cléac'h
And here a wavelet transform of the ideal reflections:
An externally hosted image should be here but it was not working when we last tested it.
It would be interesting to see what would be the 'best' CSD one could possible get out of this IR!!
Attachments
Last edited:
This topic is a bit beyond my understanding, but I want to add my 2 cents. The horns I've owned with "honk" have been a Klipsch KG5.5:
And a Horn that was the measurements of the Pi conical midhorn made out of "1/8 inch hardboard" and braced with spare 1X3s and hardwood floor varnish.


The one with the least "honk" is:
My guess is it's something to do with the asymmetry or the sharp discontinuation of the vertical and horizontal slope has more to do with honk. Might there be some measurement you're not looking at to account for honk?
Dan
An externally hosted image should be here but it was not working when we last tested it.
And a Horn that was the measurements of the Pi conical midhorn made out of "1/8 inch hardboard" and braced with spare 1X3s and hardwood floor varnish.
The one with the least "honk" is:
An externally hosted image should be here but it was not working when we last tested it.
My guess is it's something to do with the asymmetry or the sharp discontinuation of the vertical and horizontal slope has more to do with honk. Might there be some measurement you're not looking at to account for honk?
Dan
Jean-Michel - how did you generate that sonogram?
I tried to duplicate it in ARTA, but below is as close as I got.
The amount of time before the impulse peak makes a big difference. I can't find a "right" way.
If I take the reflection file and kill all the reflections, then a sonogram shows a straight red line at the top. The thickness of the line (time) depends on where the left cursor is placed.
Attachments
This topic is a bit beyond my understanding, but I want to add my 2 cents. The horns I've owned with "honk" have been a Klipsch KG5.5:
The one with the least "honk" is:
An externally hosted image should be here but it was not working when we last tested it.
My guess is it's something to do with the asymmetry or the sharp discontinuation of the vertical and horizontal slope has more to do with honk. Might there be some measurement you're not looking at to account for honk?
Dan
Interesting, I have that PE round waveguide with a Selenium Screw on CD and it honks more then my QSC waveguides but I will admit Im not sure what a honk is....its it the glaring sound when on axis?
Did you guys ever look at the topic of this thread? Could you take all this rambling somewhere else?
A remarkable statement, Earl !
Are you in fear of just another "Waterloo" or are you t(s)elling us that horn honk - per se - does not apply to oblade spheroide horn contour ?
this is in continuation of thoughts related to horn honk that started out at Earls thread but was not welcome there
It seems that the shape requirement for low honk and contant directivity are contradicting. No wonder Earl went for foam. I'm still going to research this a bit more, but it certainly was not what I expected.

Soongsc, those findings to me appear just as to be the most logical consequence – now outlined in some detail – of Jean-Michel's simple yet so ingenious philosophy regarding wave front propagation and what's also reflected in my concept of "diffraction alignment".
But again, let's not forget about other juicy aspects of horn honk...
Michael
Last edited:
I'm torn between using them as we normally do and isolating them from outside influences. I can see the merits of both.
That's kind an easy question
Have a look at this plot :

What do we see?
A forest "convoluting" with the landscape !
Meaning – no matter if the forest is on a plain flat landscape or covers beautiful hills – its always the same forest you see .
Same with CSD .
Its the *pattern* we are after ! - and that pattern repeats roughly the same all over the room response.
It gets more difficult if we do not have *such* a clear pattern to look after – I possibly have to admit...
I'd better go and measure the 0 and 180deg horn instead of producing more ****
Michael
Interesting, I have that PE round waveguide with a Selenium Screw on CD and it honks more then my QSC waveguides but I will admit Im not sure what a honk is....its it the glaring sound when on axis?
I think it's a glaring sound on any or every axis. But that's a good point, what's the definition? The PE WG did have a honky sound on axis prior to EQ, still nothing like the Klipsch. The Klipsch had a huge spike in the FR though. Now I'd have to go back and listen on axis as I haven't done so since the design phase. Makes me wonder.
Roughly what frequency range were(are) you hearing honk? It's hard for me to tell.
Yep, still there centered on axis and up close. Further away it diminishes, but close up it never goes away until it's extremely quiet. Maybe on axis has something to do with it? That's how I listened to both the other horns........
No way to go back now. Hopefully something will come out of this thread.A little experiment:
Listening pretty loud right now, by my standards, at average 74-84 db according to Rat shack meter, and no detectable honk at couch listening position. It reads 94-100 db at about 6 inches from the horn with some honk noticed, only one speaker on. It seems to greatly depend on the music. So maybe it's not even honk--it could be the music. Listening to "After Midnight" by the Grateful Dead, no detectable honk, but the previous song with a honk character had electric guitar with feedback. Maybe it's slight deafness. My ears feel a bit deafened right now going back to my couch for a listen.
Dan
PS. bet this post doesn't help at all.
Last edited:
Hello Jean-Michel,
Only thing wavelets have favor for is reality. Wavelets are real signals. Wavelet you can generate with your signal generator, you can see them as they are in your oscilloscope, you can feed them into your amplifier, you can play them through with your speakers, and you can listen to them.
None of this is possible with CSD.
Wavelets are reality. CSD is a mathematical artefact.
I think there is no "balance" in CSD. It's only artificial processing with no resemblance with the reality.
Here I attach a multiresolution wavelet tranform of the ideal 1ms reflections. It shows correctly the comb filtering of the fundamental wave, where as CSD fails to do this (as seen in your plot). Of course naturally the 1ms reflections are also present.
- Elias
Only thing wavelets have favor for is reality. Wavelets are real signals. Wavelet you can generate with your signal generator, you can see them as they are in your oscilloscope, you can feed them into your amplifier, you can play them through with your speakers, and you can listen to them.
None of this is possible with CSD.
Wavelets are reality. CSD is a mathematical artefact.
I think there is no "balance" in CSD. It's only artificial processing with no resemblance with the reality.
Here I attach a multiresolution wavelet tranform of the ideal 1ms reflections. It shows correctly the comb filtering of the fundamental wave, where as CSD fails to do this (as seen in your plot). Of course naturally the 1ms reflections are also present.
An externally hosted image should be here but it was not working when we last tested it.
- Elias
Hello Elias,
May be not the best but a normal CSD for that series of pulses separated by 1 ms will looks as in the attached graph.
As I said previously wavelets have a strong tendancy to favor the temporal aspect of the signal. (Specially with such a "thin" wavelet as you are using). Also - as it is perfectly seen in your example- we loose all temporal prcision at low frequency (we don't see anything below 1kHz in you wavelets graph).
With the CSD we can obtain a (IMHO better) balance between the temporal effect (the time series of pulses) and their comb filtering effect better illustrated in the frequency domain. Below 500Hz we can still separate the pulses...
Best regards from Paris, France
Jean-Michel Le Cléac'h
Hello Elias,
I don't want to dismiss your work for sure. I simply doubt that wavelets will be the unique solution to the problem of how honkiness can be seen and analyzed.
For me the reality of both wavelets, CSD, Wigner-Deville,etc... is all the same. They are tools to help us to understand how our acoustical devices behave. If we use them correctly both those methods can give similar results.
I don't take in account the graphical appearance in itself. The important thing is the information content, not the beauty of the graph.(That's why when I use CSD myself I avoid smoothing). CSD in ARTA may be consider by many as little games, they don't look good, but the information it contain is fully reliable and can be associated to what we perceive.
Let's come back to honkiness. The different CSD, Wavelets graphs and discussions until now have not succeed in defining its character.
IMHO:
1) honkiness is not an high frequency thing, much more important is to look for features appearing at f<1kHz. (even a Le Cléac'h horn can sound honk if the high pass filter used with it is set at a too much low frequency)
2) honkiness is not a low SPL level thing, much more important is to look for features appearing at relative level over -20dB
At high frequency, reflections, HOMs, etc. don't lead to honkness but to harshness, brighthness,....
Honkiness doesn't sound the same for an hyperbolic type horn and for a waveguide/conical horn. (I guess that large reflection from mouth to diaphragm charcterize the honkiness in waveguides/conical horns and that reactance increase nearby Fc dominate in the honkiness for exponential, hypex,...horns)
All of this is only the results of my own experience on horns.
Now the discussion, has evolved in a strange direction on the basis of your wavelets analysis. I guess readers could wrongly consider that the temporal effect is more audible than the frequency effect which is surely not. IMHO in your example, the comb filtering effect (or whatever effect - not only "wide frequency range"- due to the interference between a direct wave and a reflected wave) with SPL peaks at 1, 2, 3, 4, 5 , 6, 7kHz, ... is what we perceive (in the precise example you took), not the 1ms time separation between reflections. That's why it is important to use an analysis method that doesn't favor the temporal appearance over the frequency appearance. Also better to use a method that can bring information at frequency below 1kHz.
Best regards from Paris, France.
Jean-Michel Le Cléac'h
Hello Jean-Michel,
Only thing wavelets have favor for is reality. Wavelets are real signals.
Here I attach a multiresolution wavelet tranform of the ideal 1ms reflections.
Last edited:
Hello Panomaniac,
Due to the length of the signal that CSD is a bit difficult to obtain.
You'll find in attached file the cursor position and the parameters I used to obtain the CSD.
Most CSD I see published on forums like DiyAudio show a time axis starting on the crest of the pulse response. I think it is more interesting to take a time origin for the CSD that allows us to analyse the rise of the pulse (as an example with certain loudspeakers we can see the high frequency starting before LF ...). That's why I like to have a blue strip on top of the CSD obtained using Arta as the one in the above link.
Best regards from Paris, France
Jean-Michel Le Cléac'h
Jean-Michel - how did you generate that sonogram?
I tried to duplicate it in ARTA, but below is as close as I got.
The amount of time before the impulse peak makes a big difference. I can't find a "right" way.
If I take the reflection file and kill all the reflections, then a sonogram shows a straight red line at the top. The thickness of the line (time) depends on where the left cursor is placed.
Attachments

Last edited:
Now the discussion, has evolved in a strange direction on the basis of your wavelets analysis. I guess readers could wrongly consider that the temporal effect is more audible than the frequency effect which is surely not. IMHO in your example, the comb filtering effect (or whatever effect - not only "wide frequency range"- due to the interference between a direct wave and a reflected wave) with SPL peaks at 1, 2, 3, 4, 5 , 6, 7kHz, ... is what we perceive (in the precise example you took), not the 1ms time separation between reflections.
That's why I invent last year my experimental device for measure the horn reflection.
It can measure the bandwith (with equalisation) of reflection in the horn.
I think it's the perfect test device for this topic, because I have invent it for that... (reflection, diffraction, honk)
Experimental highlight of horn reflection's
Hello soongsc,
"It seems"
How is the conclusion about the constant directivity/honk contradict obtained?
- Elias
"It seems"
How is the conclusion about the constant directivity/honk contradict obtained?
- Elias
It seems that the shape requirement for low honk and contant directivity are contradicting. No wonder Earl went for foam. I'm still going to research this a bit more, but it certainly was not what I expected.
Hello Michael,
As the steps are considered, they will be visible if the CSD FFT window length is longer than the time between reflections. That's it!
- Elias
As the steps are considered, they will be visible if the CSD FFT window length is longer than the time between reflections. That's it!
- Elias
Will see how *I* possibly can verify any further that those decay in steps is speaker related (will have to ask for the ST 350 again).
- Status
- This old topic is closed. If you want to reopen this topic, contact a moderator using the "Report Post" button.
- Home
- Loudspeakers
- Multi-Way
- Horn Honk $$ WANTED $$