Impulse Response
Hi All,
I have a very basic question --
I understand how the frequency response plot is obtained -- An increasing-frequency signal is fed to the driver under test and the resulting sound is plotted (frequency vs db).
My question is - how and when is the impulse response taken:
-- Is it taken after of before the frequency response is taken?
-- What is the signal that is generating the impulse? Is it just a burst? Or, is it a particular shape (like a triangle wave, square wave, etc.)?
Thanks,
Steve
That's not actually how it works. You play and record the sweep. Then the high level version is you do some processing on the data to obtain the impulse response and the impulses of the distortion. Then you perform a FFT using whatever windowing you have specified on the impulse to get the frequency response, and FFT's on the distortion impulses to get the frequency response of the various orders of harmonic distortion. It's a method developed by Farina.
Last edited:
That's not actually how it works. You play and record the sweep. Then the high level version is you do some processing on the data to obtain the impulse response and the impulses of the distortion. Then you perform a FFT using whatever windowing you have specified on the impulse to get the frequency response, and FFT's on the distortion impulses to get the frequency response of the various orders of harmonic distortion. It's a method developed by Farina.
What does FFT stand for?
FFT
Hi DQ828,
FFT stands for Fast Fourier Transform. It's a mathematical manipulation of the raw data points. Unfortunately, I can't do a good job of explaining it. For years I have had trouble getting a good grip on Fourier Transforms. Hopefully someone else can give a good explanation of the details.
Steve
measurement help
Hey guys,
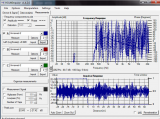
This is one of my first measurements. My woofer's measurement looks pretty typical of what a measuremnt should look like. But, the above picture is of my midhorn (compression driver)'s measurement. Does it look like I might have made some obvious error in my setup?
Thanks,
Steve
Hey guys,
This is one of my first measurements. My woofer's measurement looks pretty typical of what a measuremnt should look like. But, the above picture is of my midhorn (compression driver)'s measurement. Does it look like I might have made some obvious error in my setup?
Thanks,
Steve
Don't look at THD, look at the individual harmonics. Especially H2, H3. That will tell you a lot more.
I did that. With HI I get similar curve shape to THD at a lower dB value.
For example: If THD ranges from 25 to 40 dB down, 3rd and 5th harmonics are 30-50 dB down.
All in all, I'm gathering my new speaker is in the range of 3-7% THD. I don't think that's too bad.
I suspect that it is background noise, ie stuff that it can't correlate back to the original signal (and harmonics thereof). It seems to be rather high in some of my measurements.
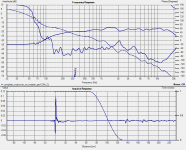
Below is the measurement of my MTM's with current crossover. The thing I found interesting with the noise is that it is highest at the 2Khz point, which co-incidently I have a major problem with my midbass drivers.... Not sure whether that means that there is some sort of 2Khz noise that is interfering with my measurements or what.....
Steve, I see no one answered your last question, though it was a while ago, I suspect maybe you were clipping your soundcard or perhaps overloading your mike or mike preamp. If your horn is a lot more sensitive than the woofer you were measuring it could explain the rather nasty plot you posted")
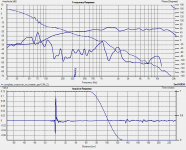
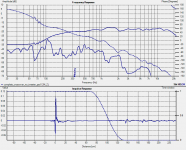
1st pic noise, 2nd pic 2nd harmonic, 3rd pic third harmonic
Tony.
Below is the measurement of my MTM's with current crossover. The thing I found interesting with the noise is that it is highest at the 2Khz point, which co-incidently I have a major problem with my midbass drivers.... Not sure whether that means that there is some sort of 2Khz noise that is interfering with my measurements or what.....
Steve, I see no one answered your last question, though it was a while ago, I suspect maybe you were clipping your soundcard or perhaps overloading your mike or mike preamp. If your horn is a lot more sensitive than the woofer you were measuring it could explain the rather nasty plot you posted
1st pic noise, 2nd pic 2nd harmonic, 3rd pic third harmonic
Tony.
Attachments
Last edited:
Speaker doctor, I realised after I posted that it wasn't obvious so edited and added the legend it is in the images but you really have to look closely! Note also that those measurements were done as swept sine with a starting frequency of 100Hz. Look at the noise plot (first pic) below 100Hz!!
Pano, It could be that the THD measurement is THD + noise, and if the non noise component of the THD is low enough in your loopback that the noise may be the dominant factor??
Tony.
it is in the images but you really have to look closely! Note also that those measurements were done as swept sine with a starting frequency of 100Hz. Look at the noise plot (first pic) below 100Hz!!Pano, It could be that the THD measurement is THD + noise, and if the non noise component of the THD is low enough in your loopback that the noise may be the dominant factor??
Tony.
Speaker doctor, I realised after I posted that it wasn't obvious so edited and added the legend
Tony.
I see some text just above the impulse response plot. Did you add that yourself? If so, how?
I've been somewhat frustrated with my inability to easily add text to images prior to saving as image files.
I see some text just above the impulse response plot. Did you add that yourself? If so, how?
I've been somewhat frustrated with my inability to easily add text to images prior to saving as image files.
Never mind answering that. I figured out how to do exactly what you did.
- Home
- Design & Build
- Software Tools
- HOLMImpulse: Measurements in practice