Here's the input screen for Hornresp. I tried to make it roughly the same as what I did in MJK's worksheet.
don't know if you're still playing w/ this but you have listed...
amp output resistance as zero ohms?
flare section one is conical, with flare cutoff frequency of zero?
(section two is exp, w/ cutoff of 54.39)
rear chamber volume is zero,
rear chamber length is zero,
it says your using a vented rear chamber;
and the vent port has an area of zero (that would make it a sealed chamber),
and the port tube length is zero (as above).
And the throat chamber is 900cc, with 350 cm avg cross section area.
don't know exactly what you're building...
i played w/ it a few minutes, changed a few things around but working w/ same mouth size (which will still produce a lot of ripple);
dropped s1 (throat) to 15.25,
s2 to 450 for mouth
con to tractrix, (which calculates out to 279.41 total)
set f12 @ 55.00
no s3
changed:
Vrc 1.52
Lrc 12.46
Fr 1
Tal 3
Vtc 64.39
Atc 78.00
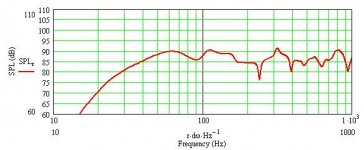
gives 60 - 1000 hz w/ ~ +/- 5 dB ripple.
open the mouth up to 4500 & get near 10 Hz more extension on the bottom, top stays about the same, but ripple goes down to about +/- 1dB...
just playing around...
")
- Status
- This old topic is closed. If you want to reopen this topic, contact a moderator using the "Report Post" button.