Hi Tom
Everyone is fine - very busy myself.
The technique that you are refering to is a kin to Acoustic Holography and Fourier Acoustics. Adding the recorded signals with different phase and amplitude creates a different virtual directivity of the array. This can be done in post processing as long as the recorded signals are all in sync or have a known relationship. The technique is not unlike Synthetic Aperature Radar, which of course has revolutionized the world of satellite imaging.
You probably did not read the earlier posts, but I am already doing something like this, albeit in reverse. If you measure the polar pattern then you can calculate back to the source magnitude and phase that created this pattern. I have software that does this. Hence, I can reconstruct the actual wavefront from my waveguides at any frequency.
The resolution of my first try was not great, but still very interesting. I am working to improve the resolution of the reconstruction, and this is where things get difficult because the numerical inversion problem tends to get unstable.
Basically, I am more than familiar with the technique, but thanks for the note.
I am in China at the moment and the video would not download to here so I can't watch it till I get home.
I'd like a little help on doing some polars.
The background story is that I suspected waveguide problems below 1kHz and I changed the crossover to 1,100Hz and from first order to second order electrical.
The result is greater coherence just below 1kHz but worse matching now and the tweeter stands out with a slightly harsh quality. I am still playing with listening axis phase.
I have two goals for taking the polars. One is to verify the polar matching of the separate crossed drivers which I intend to do by going horizontally. The other goal is to verify that power response is not compromised by phase anomalies which I intend to do by measuring vertically.
The questions I have are:
1) am I looking at the right things,
2) can I limit measurement to, say 60 degrees as I'm not interested in <500Hz
3) can I swing the mic on an axis located between the acoustic centres of the drivers,
4) will measuring at 1m, using 6th octave smoothing and gating away all reflections give me the info I need for each of these two measurement types?
Hi AllenB
Don't swing the mic, rotate the speaker. Setup the speaker to mic situation to best utilize the space - usually across the diagonal. Use the greatest speaker to mic distance possible while maximizing the time delay to the first reflection. Of course the speaker has to be on a stand, so you may as well have the top plate rotate and mark the angles on it. I would go to 90 degrees. Horizontal is most important, so get that right. Vertical is less important, you just need to know that the forward lobe is centered - so out to maybe 30 degrees vertical is fine. Horizontal should be symmetric so you only need to do one side. Vertical will not be symmetrical.
Don't swing the mic, rotate the speaker. Setup the speaker to mic situation to best utilize the space - usually across the diagonal. Use the greatest speaker to mic distance possible while maximizing the time delay to the first reflection. Of course the speaker has to be on a stand, so you may as well have the top plate rotate and mark the angles on it. I would go to 90 degrees. Horizontal is most important, so get that right. Vertical is less important, you just need to know that the forward lobe is centered - so out to maybe 30 degrees vertical is fine. Horizontal should be symmetric so you only need to do one side. Vertical will not be symmetrical.
With a ceiling height of 2.7m, and distance from the tweeter to the bottom of the woofer of 0.6m, I can't expect better than 3.3ms when back by 3x driver width.
At 3.3ms, I begin to lose confidence in anything below 1kHz even though the reciprocal of 3.3ms is 300Hz. Is this wrong, can I trust this low at this gating time?
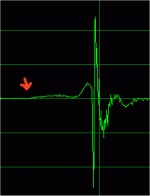
Also in the impulse below, is it safe to start counting the 3.3ms from the arrow shown?
At 3.3ms, I begin to lose confidence in anything below 1kHz even though the reciprocal of 3.3ms is 300Hz. Is this wrong, can I trust this low at this gating time?
Also in the impulse below, is it safe to start counting the 3.3ms from the arrow shown?
Attachments
I'm not following the questions.
The "window" is from the start of the impulse - which is well right of you red arrow - to the start of the first "major" reflection. There might be some smaller diffractions from the test stand, but these should not be major problems. Best thing toi do is to draw your room and plot out the first reflections and where to put the speaker and the mic to make the difference of direct and reflection as great as possible. 3.3 is a bit on the short side. I usually get 5-6 ms in my room, but it is a large room.
The "window" is from the start of the impulse - which is well right of you red arrow - to the start of the first "major" reflection. There might be some smaller diffractions from the test stand, but these should not be major problems. Best thing toi do is to draw your room and plot out the first reflections and where to put the speaker and the mic to make the difference of direct and reflection as great as possible. 3.3 is a bit on the short side. I usually get 5-6 ms in my room, but it is a large room.
Where I get the 3.3 from was firstly the assumption that I need to place the source and mic at half room height to make floor and ceiling reflections equally distant. Then with 1.2m source/mic separation, those reflections would be 1.2m behind (and further mic positions would only be worse). I would then set mic and source 0.6m from anything. I can't see how I could get better.
With regards to the start of the impulse, I guess I was thinking in terms of a step response.
With regards to the start of the impulse, I guess I was thinking in terms of a step response.
I didn't actually check your calculations, but you have the right idea. The floor-ceiling height is usually the limiting factor and it certainly is in your case. Move the mic forward a little if this helps extend the window time - tradeoffs both ways, but you have to live with what you have.
Also in the impulse below, is it safe to start counting the 3.3ms from the arrow shown?
Does your system have a horn long enough that the woofer impulse arrives first? That is what your picture looks like. If so then your arrow is in about the right place although it wouldn't hurt to crank up the gain a little to make sure that it didn't start a little earlier (then drop the gain back for the measurement). Hard to tell with woofer impulses since the energy is well spread over time and thus low in "height".
Starting the window too early never hurts anything other than adding extra phase rotation to the measurement.
David S.
Data is coming in loud and clear, thank you.
Am I likely to get better phase information from calculating minimum phase from a composite power response, or measuring on the listening axis using continuous noise? Should I find a better way?
Dave, that impulse I used was with subs turned on (realised after I posted.)
Am I likely to get better phase information from calculating minimum phase from a composite power response, or measuring on the listening axis using continuous noise? Should I find a better way?
Dave, that impulse I used was with subs turned on (realised after I posted.)
Are you using HolmImpulse? You should be and you should not be using noise. Use log-sweep. If you are measuring the systems polar response why do you need phase? Its not possible to get phase from a power response since power has no phase. So I am not sure what you are asking here.
I am using ARTA to take impulses with log-sweeps, and I use another RTA for phase, just because I am used to that but it doesn't do log-sweeps.
I want phase because I like to sim my crossovers. When I said power response, I meant the frequency response average. I'd like to predict my vertical nulls before I pick up a soldering iron.
Due to complications such as recent cabinet mods, I decided to take separate driver responses this time around. I will sim the polars from this new data and verify it after I have done the crossover.
So I guess the questions I have are,
1/is an ARTA impulse useable,
2/will holm, gated on the listening axis be good for phase
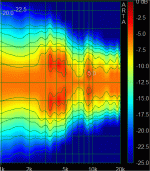
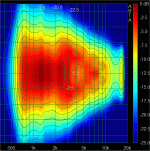
3/is this (below) a matter of mouth termination? (I normalised this otherwise it wasn't obvious.)
I want phase because I like to sim my crossovers. When I said power response, I meant the frequency response average. I'd like to predict my vertical nulls before I pick up a soldering iron.
Due to complications such as recent cabinet mods, I decided to take separate driver responses this time around. I will sim the polars from this new data and verify it after I have done the crossover.
So I guess the questions I have are,
1/is an ARTA impulse useable,
2/will holm, gated on the listening axis be good for phase
3/is this (below) a matter of mouth termination? (I normalised this otherwise it wasn't obvious.)
Attachments
If you have a "true" impulse response - from Holm or anything else - then you have the phase as well. It is part of the impulse response and nothing else need be calculated (beyond doing an FFT). By "true" I mean an impulse that is created by convolution and not from a magnitude only frequency response. I do not know what ARTA does, but I know that Holm is "true".
Since your data plot is normalized, there is no way to tell for sure, thats why I never normalize. I would guess at "yes", but I would need to see the data unormalized to be sure. I simply do not understand why people normalize the data because it makes it less useful, not more.
Since your data plot is normalized, there is no way to tell for sure, thats why I never normalize. I would guess at "yes", but I would need to see the data unormalized to be sure. I simply do not understand why people normalize the data because it makes it less useful, not more.
I assume this doesn't necessarily 'require' a two channel measurement.By "true" I mean an impulse that is created by convolution and not from a magnitude only frequency response.
In my case because it looked similar to something I'd seen before. Here is the straight sonogram.why people normalize the data
Attachments
")
ARTA can do accurate phase measurements. But you will indeed have to do dual-channel measurements if you want to measure two drivers and design a crossover based on those measurements. Only if you use the dual-channel mode the system will have constant latency. This is important, because otherwise you won't be able to determine where the acoustic centres are relative to each other.
The way I do it is as follows:
1) Measure the (driver which arrives first, which in this case is the...) woofer.
2) Click the 'Get' button for optimal phase estimation. The marker will be placed at the top of the impulse.
3) Now put the marker a little before the first significant reflection and just leave the cursor untouched.
4) View the response and phase and generate an ASCII-file.
5) Measure the tweeter.
6) Don't touch the marker or cursor.
7) View the response and phase and generate an ASCII-file.
or you can measure each individually and then both together, with one wired so as to give a null where they both play (might want to include a blocking cap to keep very low freqs out of the tweeter). Then in your crossover simulator (PCD?) use the individual files, simulate both playing together with no crossover and adjust the delay offset till you arrive at the same "both together" response... that's the correct relative delay for where you measured from. (Only the relative delay between the two drivers matters).
I assume this doesn't necessarily 'require' a two channel measurement.
In my case because it looked similar to something I'd seen before. Here is the straight sonogram.
It doesn't require two channels if you somehow know the input waveform. Holm does not require two channels and it does phase. Thats because it knows exactly the signal that it sent out, so it can do the deconvolution with a reconstruction of this signal.
The 1.5 kHz is a resonance, probably in the driver. The narrowing at 2 kHz is probably because the waveguide is too small. The stuff above 2-3 kHz is typical mouth diffraction aberations.
Last edited:
The narrowing at 2 kHz is probably because the waveguide is too small.
This waveguide is 18" after mouth rounding.
I have a suspicion. This was an 8" w/g that I extended conically to 15". The extension may be doing nothing more than containing the wave.
Thanks again for your help. I wish it were easier to make or get waveguides.
Rob, yes that's exactly what it is.
keyser, bwaslo, thanks. Now I'm glad to at least be rid of my old RTA which I kept for just one reason.
Earl, I have short term plans to increase the roundover radius and maybe incorporate a 'supra baffle' as planet10 calls them. I suspect the other problems will EQ out (largely, anyhow).
keyser, bwaslo, thanks. Now I'm glad to at least be rid of my old RTA which I kept for just one reason.
Earl, I have short term plans to increase the roundover radius and maybe incorporate a 'supra baffle' as planet10 calls them. I suspect the other problems will EQ out (largely, anyhow).
- Home
- Loudspeakers
- Multi-Way
- Geddes on Waveguides