Averaging across the couch and correcting will result in better, but not the best, sound in those positions where it was measured. Measuring just at one place and correcting will result in the best sound at that position, and may or may not improve it elsewhere (depending on speaker location and directivity). You takes your poison, and you lives with it! I personally could care less how it sounds at locations other than the listening spot because for more 95% of the time it's me and me alone doing the listening. And the remaining seats are not that bad either. All of the above is especially true about the low frequencies.
The more consistently the speaker measures in an average the better as far as I am concerned as it will sound more even across that area than one that varies significantly. Fortunately the arrays seem to do a good job of that. Wesayso has shown a very good correlation between an average and single point measurement in his thread. In my measurements the room is more of a factor and the averaging helps to not overdo the correction in general and gives a more quasi anechoic response to work from.
I agree in general with what you say which is why it important to look at all the graphs in the average to see if the sum is a better representation. The benefit to the averaging is that you can apply a stronger correction without the risk of making it very position dependant. Depending on the results it might still be better to use a single point. I don't often sit directly in the centre as I have a large two seater couch and right in the middle is not so comfortable and harder to recline")
I agree in general with what you say which is why it important to look at all the graphs in the average to see if the sum is a better representation. The benefit to the averaging is that you can apply a stronger correction without the risk of making it very position dependant. Depending on the results it might still be better to use a single point. I don't often sit directly in the centre as I have a large two seater couch and right in the middle is not so comfortable and harder to recline
For me, measuring at one spot has worked quite well, though I've always manually dialed down the DRC (possible over) correction at certain spots. This is what the averaging does automatically.
We do get effects of comb filtering at the single measurement position. Letting in surrounding measurements will filter out the few peaks that could emerge from a single spot correction when one isn't exactly in that measurement spot with the ears.
These comb patterns are not really seen in the FDW from REW except, maybe in the clean outdoor measurements done by fluid.
We do still see that comb behavior in the early waterfall plots.
I've done a series of measurements and first will correct based on a multi seat set, but I can also choose to only use the ones that correspond best with the left and right ear position (with some wiggle room included).
I like these options to try and see what works best, one could measure exactly at the left and right ear. I know jim1961 does exactly that in his room. Up till now I've always used one single spot. With the series of measurements I have proven (again, as I had done this once before) the consistency of the arrays over a larger area. But it also gives me more options to try later on.
FR and phase of the single point measurement is in close agreement with the center point measurement, it has one other advantage though. It is more free of reflections, just as fluid said. You get closer to viewing the speaker output without the reflections that are very place dependent.
You can't easily filter out those from a single point measurement. Move just a cm and their influence will change. This is why my results are pretty close as I did try to absorb as much of the early reflections as I could.
I've been making steady progress behind the scenes and getting to enjoy listening to the speakers a bit more.
I took some new measurements after the position change and they are an improvement.
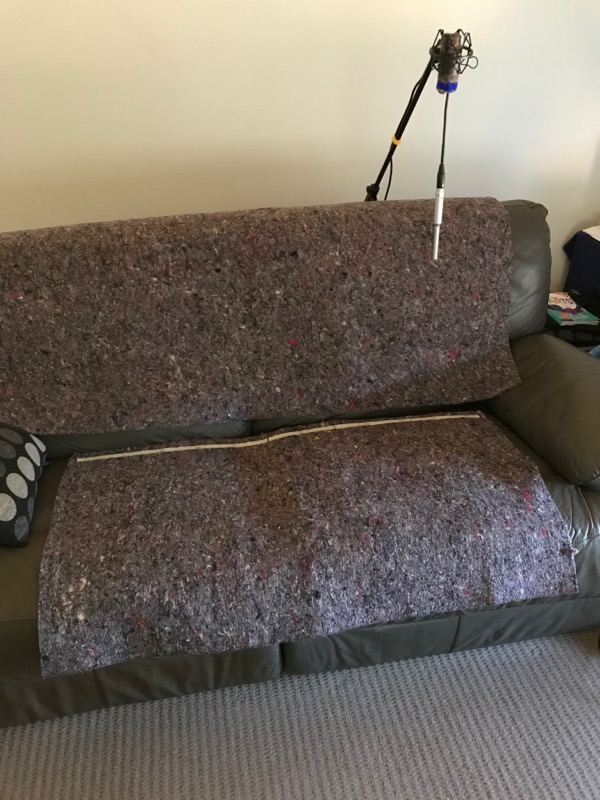
Here is a picture of the mic setup, I read a write up on a minidsp where there was a description of the setup and it made sense to me so I tried it. It has helped to clean up some of the very early reflections I had before which were coming from the couch.
miniDSP DDRC-22D Dirac Live® 24/96 Room Correction Audio Processor Review - Home Theater Forum and Systems - HomeTheaterShack.com
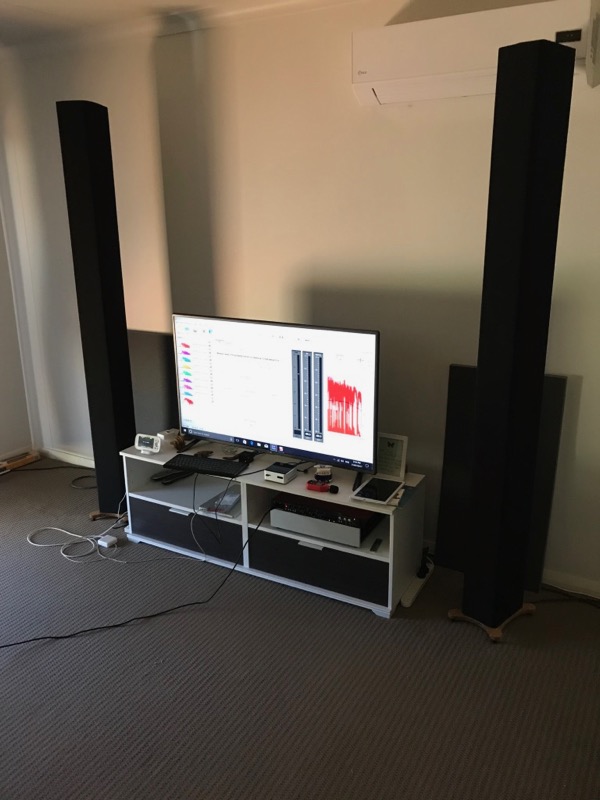
Here is a picture of the new speaker positions
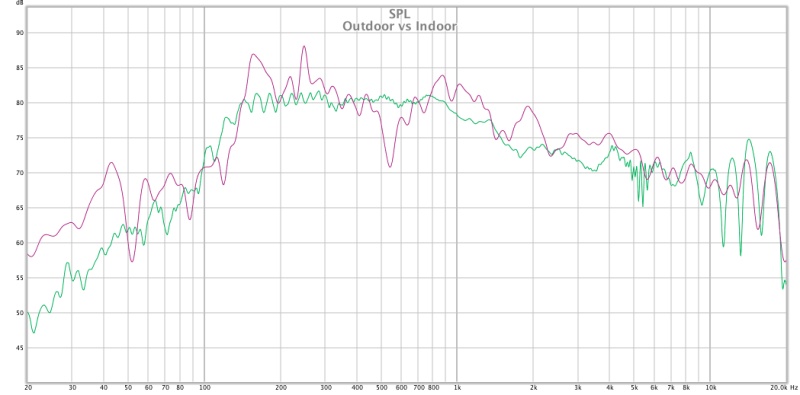
Here is a comparison measurement for samuelj, indoor vs outdoor. The SPL should be fairly accurate but as they were not taken with the same equipment at the same time there could be some variance. The outdoor was also directly on axis where the indoor is slightly off axis. There is the expected 8dB or so rise in the low frequencies from 100Hz down. The main modes at 44 and 88 are obvious and a dip which can't really be avoided easily. Much better overall than what I had before.
This ETC shows what happens due to averaging, you can see the level of room contribution goes down significantly. This measurement was an average of nine positions. The more averages the more the room is suppressed but it does take a long time to record them. I think 9 is about the sweet spot for me.
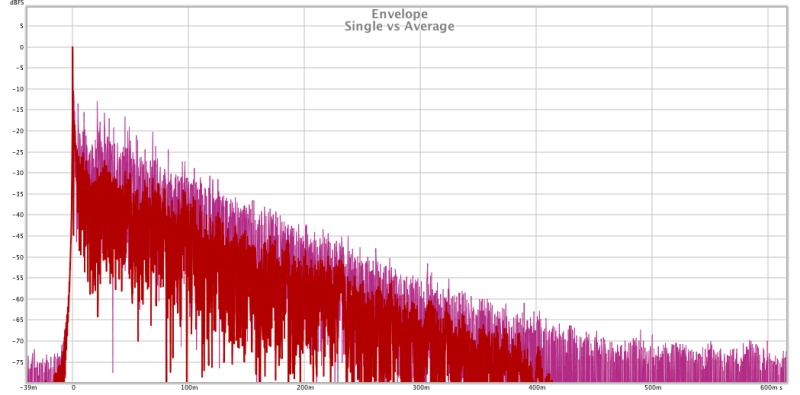
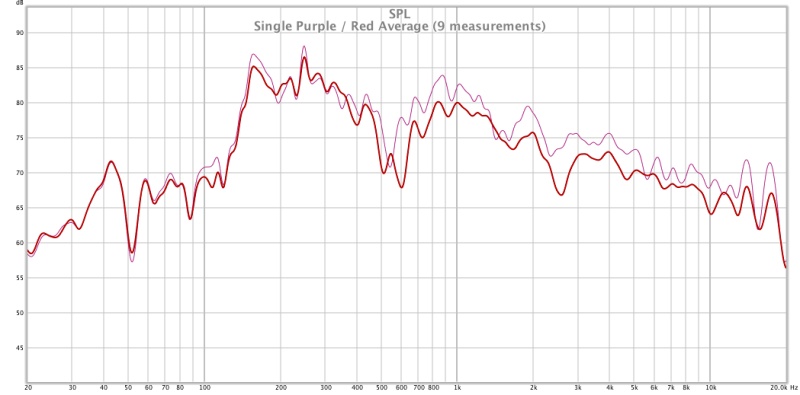
This the SPL difference in single vs average for one channel
I took some new measurements after the position change and they are an improvement.
Here is a picture of the mic setup, I read a write up on a minidsp where there was a description of the setup and it made sense to me so I tried it. It has helped to clean up some of the very early reflections I had before which were coming from the couch.
miniDSP DDRC-22D Dirac Live® 24/96 Room Correction Audio Processor Review - Home Theater Forum and Systems - HomeTheaterShack.com
Here is a picture of the new speaker positions
Here is a comparison measurement for samuelj, indoor vs outdoor. The SPL should be fairly accurate but as they were not taken with the same equipment at the same time there could be some variance. The outdoor was also directly on axis where the indoor is slightly off axis. There is the expected 8dB or so rise in the low frequencies from 100Hz down. The main modes at 44 and 88 are obvious and a dip which can't really be avoided easily. Much better overall than what I had before.
This ETC shows what happens due to averaging, you can see the level of room contribution goes down significantly. This measurement was an average of nine positions. The more averages the more the room is suppressed but it does take a long time to record them. I think 9 is about the sweet spot for me.
This the SPL difference in single vs average for one channel
Attachments


Don't know if horisontal directivity is the same in room as in free field when the array height is the 'same' as the room heigth.
Think reflections from elements near ceilling and floor is present in your case.
Se you have a reflection at -13 dB ETC that is close to the main lobe.
Is this the backwall reflection at about 16cm from the mic? So extra pathlength is 32 cm and that reflection will cancel wavelengths of 64 cm.
That is about 530 Hz.
Then the ETC should show an energy burst at a little less than 2 ms after main lobe.
The avaraging with different lengths to backwall and broader dip also suggests this.
If this is the case be very carefull about have an EQ top at 550Hz. That EQ top will also attunate the back wall reflection where it maks most damage.
A last issue is the overlay between outdoor and indoor measurement.
I would be suprised if you have 5dB room gain from 800Hz to 4k Hz.
Thank you again for posting very interesting measurements of your construction and room!
For a room with such little wall treatment (bookshelfs/pictures etc) and sitting that close to the back wall the measurements are actually very good.
A few comments, fluid:
- That mic setup looks strange to me. The mic response is not omni as far as I know. It will have a very different response pointing downwards compared to pointing towards the speakers.
- What is the material on the couch? From the pic, it looks like a felt mat. That's going to absorb only the very highest of frequencies. You need at least 2 inch thick fiberglass/denim style insulation on there to have a meaningful absorption in the mid frequencies. 4 inch thick is better.
- Early reflections from the stuff near the speakers will be hard to get rid off. That's life. You just live with it.
- The dip at 550 Hz corresponds to about 2 ft. Is the speaker to front wall distance about 1 ft? What happens if you push the speakers right up against the front wall?
- I don't see how the room is suppressed. If the room were suppressed, wouldn't your averaged chart look smoother, i.e., less wiggles? If the reflection levels go down, it should look more like the outdoor chart.
- Finally, it is hard to believe the sub-100 Hz response in the averaged measurement. If you measured across the couch, there is no way your sub-100 Hz will be identical to the single measurement. Something is off there, could be the mic, could be something else. Probably worth investigating further.
I don't understand what you mean here. The arraying in theory does not change the horizontal directivity. I see no reason why it would be different between indoors and outdoors. The array has controlled vertical directivity, exactly how much I cannot tell you but when I measured them outdoors I got very good low frequency resolution when the signal level was high enough. This would not have been possible if the vertical directivity wasn't there, the speaker was not very high off the ground. A more standard speaker would have needed a ground plane or high tower measurement to get the same reflection free result.Don't know if horisontal directivity is the same in room as in free field when the array height is the 'same' as the room heigth.
Think reflections from elements near ceilling and floor is present in your case.
No the back wall is at 1m from the mic position. The 32cm path length corresponds to the distance between the array and my TV unit. There will be some change around that area due to not all the drivers having the same distance from that surface.Se you have a reflection at -13 dB ETC that is close to the main lobe.
Is this the backwall reflection at about 16cm from the mic? So extra pathlength is 32 cm and that reflection will cancel wavelengths of 64 cm.
That is about 530 Hz.
Then the ETC should show an energy burst at a little less than 2 ms after main lobe.
The avaraging with different lengths to backwall and broader dip also suggests this.
If this is the case be very carefull about have an EQ top at 550Hz. That EQ top will also attunate the back wall reflection where it maks most damage.
The very early reflections are still from the couch. The felt has suppressed but not eliminated them. The earlier measurements without the felt had a very strong early reflection.
I thought I had added enough disclaimers to go with that comparison but obviously not. There are modal peaks and reflection induced nulls and the measurements were not taken on the same axis so above 200Hz is not going to be a good comparison. samuelj asked for room gain and I think that part is valid. REW was calibrated to an SPL meter in both cases and there is no offset added so the values should be consistent within about 3dB at least below 100Hz.A last issue is the overlay between outdoor and indoor measurement.
I would be suprised if you have 5dB room gain from 800Hz to 4k Hz.
Thank you again for posting very interesting measurements of your construction and room!
For a room with such little wall treatment (bookshelfs/pictures etc) and sitting that close to the back wall the measurements are actually very good.
Well you saved the best for last
I am also quite pleased with the result but I'm not sitting as close to the back wall as you think (there is 1m).The mic is most certainly omni and the 90 degree position is the position the manufacturer uses as part of their own room measurement/EQ solution. They only supply a 0 degree calibration file but it isn't that hard to make your own 90 degree file I linked the article I used to do it earlier. The difference is really only at the highest frequencies.A few comments, fluid:
- That mic setup looks strange to me. The mic response is not omni as far as I know. It will have a very different response pointing downwards compared to pointing towards the speakers.
The reason why I use a 90 degree position is because I don't have to change it between measuring the Left and Right speakers. It is very hard to consistently place the microphone tip in exactly the same position when changing the angle of it. You might have a wizz bang mic stand or some clever method of doing it. I just found it frustrating and inaccurate so I don't bother.
This is a comparison measurement of the supplied 0 degree calibration file dead on axis versus the mic at 90 degrees with my generated file in as close to the same position as I could line it up. I am happy with the tolerance. If you use a minidsp UMIK they provide generated 90 degree files too although I can't vouch for their accuracy as I think they just introduce the same offset into the original calibration file. Try it for yourself and see.
The material is felt about 10mm thick. You are quite right in your description of the type of absorption needed if I was trying to kill the reflection.- What is the material on the couch? From the pic, it looks like a felt mat. That's going to absorb only the very highest of frequencies. You need at least 2 inch thick fiberglass/denim style insulation on there to have a meaningful absorption in the mid frequencies. 4 inch thick is better.
- Early reflections from the stuff near the speakers will be hard to get rid off. That's life. You just live with it.
When did I say it absorbed all the energy from the couch? I put it there to see what effect it would have on the measurement and it did a pretty good job of reducing some very strong, very early reflections I had in the first set of measurements (not posted). For me it is useful and shows just how reflective my couch actually is.
Front baffle to front wall distance is about 50cm so closer to 2ft than 1 foot. There is an air-conditioning unit visible behind the speaker in the picture so the speakers cannot go against the wall unless I move them further apart. When they are further apart there is an awful 100Hz null through almost the entire room which is why I moved them. I based the position on an REW room sim and it was really quite accurate in predicting the response below 200Hz. Virtually placing them against the front wall resulted in a much worse response. I am happy with where they are placed now in terms of bass response although it has introduced more variation in the higher frequencies.- The dip at 550 Hz corresponds to about 2 ft. Is the speaker to front wall distance about 1 ft? What happens if you push the speakers right up against the front wall?
I will try and explain it. Look at the ETC. You can see that the red level is significantly below the purple in both level and how long it lasts for. That means there is less energy for less time ergo less room.- I don't see how the room is suppressed. If the room were suppressed, wouldn't your averaged chart look smoother, i.e., less wiggles? If the reflection levels go down, it should look more like the outdoor chart.
The averaging I have shown is impulse response averaging so it can be used with DRC. This is different than pure frequency averaging and gives a different response. Here is a comparison of my first measurements above 200Hz. There are 22 measurements used. The gold is pure frequency average, nice and smooth, the purple is impulse average, not so smooth but you can see that the room contribution has been reduced as the level above the transition frequency is reduced more and more as you average more measurements.
This graph show a single measurement and the 22 measurement average at 1/48 smoothing. You can see that the average has a lot less of the small wiggles which are the result of the position dependent room interference in the single point.
What I am trying to achieve with the impulse averaging is a more quasi anechoic response that includes the most prominent room induced peaks and dips which are not totally position dependent. That is why I have settled on using 9 averages. The image below shows all the individual traces together with the vector average in purple. You can see that the frequency average lines up in the middle of the traces and the impulse average has the room contribution suppressed. When I compare the RT60 of my room to these graphs it makes complete sense.
For me it's not hard to believe and nothing is off. What that graph showed was that the centre position is very close to the average nothing more. Don't worry there is much more variation across the couch but still pretty well controlled. That is what I like about using the arrays full range. The bass is very even. Here's the graph to show the variation.- Finally, it is hard to believe the sub-100 Hz response in the averaged measurement. If you measured across the couch, there is no way your sub-100 Hz will be identical to the single measurement. Something is off there, could be the mic, could be something else. Probably worth investigating further.
Attachments


Hello Fluid,
Thank you so much for sharing the room gain curve as I was very curious about that I am baffled how it is so close to your predicted/simulated curve. There seems to be some low Q dip around 100-150Hz. For room gain study purpose, I will consider a smoothed out version of the indoor curve below 80Hz. I was concerned about the 1-4k gain, but then the average response takes care of that.
I assume you have used FDW of 1/6 for the indoor measurements or am I wrong?
I guess you are still playing around a final curve for your arrays that you can settle down with, hope to see that soon.
Thank you so much for sharing the room gain curve as I was very curious about that
I am baffled how it is so close to your predicted/simulated curve. There seems to be some low Q dip around 100-150Hz. For room gain study purpose, I will consider a smoothed out version of the indoor curve below 80Hz. I was concerned about the 1-4k gain, but then the average response takes care of that. I assume you have used FDW of 1/6 for the indoor measurements or am I wrong?
I guess you are still playing around a final curve for your arrays that you can settle down with, hope to see that soon.
This is really interesting. Can you please tell what gating/window you are using?
Based on the same measurements, just varying the averaging method you get curves with a significant 5dB difference. So, which one do you use to get the ideal psychological flat room curve. If I am not wrong, the final curve that Wesayso shows is based on frequency averaging.
REW has only recently come up with impulse averaging, which seems awesome.
But a target curve based on that might be too hot in the HF area.
My original correction was based on single point measurements. Over time I have reduced reflections in my room trough adding damping panels in key locations. (first reflection points)This is really interesting. Can you please tell what gating/window you are using?
Based on the same measurements, just varying the averaging method you get curves with a significant 5dB difference. So, which one do you use to get the ideal psychological flat room curve. If I am not wrong, the final curve that Wesayso shows is based on frequency averaging.
REW has only recently come up with impulse averaging, which seems awesome.
But a target curve based on that might be too hot in the HF area.
My latest graphs were based on IR averages. Inspired by measurements from Fluid and I always wanted to compare those two methods. The center point measurement has a very close resemblance to an 8 point average along my seating area. However since I have reduced reflections I only took 4 averages into account for my current experiment.
A weighted average around the left and right ear position. Not a FR average, an IR average to be able to use it with DRC.
Phase curves of this average and my usual center measurement are spitting images. For all practical purposes usable enough to use for DRC processing.
Hope that helps.
Last edited:
The boundary conditions of the array are of course important for the directivety
And reflections of floor and ceilling is only about 45 degrees or less of axis.
I would have a look at the floor reflection instead of the TV as of the mid band cancelling.
And even if it is not back wall reflection it is still important not to rise the frequencybands with most reflection as it will rise early reflections.
As of 1 m from back wall. EBU recomends 1.5 meter minimum from back wall.
Link the european brodcasting union spec of good listening conditions (in control rooms):
https://tech.ebu.ch/docs/tech/tech3276.pdf
It is quite some man hours of experience behind it.
It seems like you are not so interested in early reflections at the ear but more total reflections in the area you are listening.
There is en difference between the EQing using wide area and neglecting first reflections that actually hits your ear.
Anyway (another topic), Harman has written a piece on the importance of a speaker looking good (as yours do) + other interesting measurement matters. Page 26.
Loudspeaker Industry Sourcebook
Link found here:
Claus Futtrup contributes to the Loudspeaker Industry Sourcebook
Last edited:
I forgot to ask if you would share a 20 ms ETC curve of one speaker. As I am specially interested in early reflections
I would also be interested in a time windowed FFT from 1 ms to 10 ms to se the frequency content of the early reflections. (Where direct sound is time windowed out)
Again, thank you for your time and effort.
Regards Torgeir
I would also be interested in a time windowed FFT from 1 ms to 10 ms to se the frequency content of the early reflections. (Where direct sound is time windowed out)
Again, thank you for your time and effort.
Regards Torgeir
Hello Fluid,
Thank you so much for sharing the room gain curve as I was very curious about that
I assume you have used FDW of 1/6 for the indoor measurements or am I wrong?
I guess you are still playing around a final curve for your arrays that you can settle down with, hope to see that soon.
You're welcome
It is fairly easy and accurate to predict modal behaviour in a room as long as it is a rectangle of some sort. Everything is based on the dimensions and the distances from surfaces. I found that by using the mid point between floor and ceiling in the REW simulations was pretty close to reality. I have found the array's work best in positions that most conventional speakers would not in my room.
No FDW used on any of those graphs. I look at the measurements through all the different levels of smoothing and windows to get a better picture of what is going on. 1/12, 1/24 or 1/48 were used in the above graphs (not including the microphone comparison that was 1/3).
I'll show the DRC predictions in another post to not confuse this one.
This is really interesting. Can you please tell what gating/window you are using?
No gating or window has been used at all.
In the graph you quoted the impulse average had 1/24 smoothing applied and the frequency average was 1/12. When I went back to check the frequency average was computed with the individual graphs at 1/12 smoothing. Removing all smoothing before averaging gives a slightly different result.
This graph is the difference between the average being done on smoothed measurements first or raw and then smoothed after. The shape is the same but the level drops. The best way to compare would always be to do the averaging on raw data. The higher (green) line is raw then smoothed.
Attachments

Based on the same measurements, just varying the averaging method you get curves with a significant 5dB difference. So, which one do you use to get the ideal psychological flat room curve. If I am not wrong, the final curve that Wesayso shows is based on frequency averaging.
REW has only recently come up with impulse averaging, which seems awesome.
But a target curve based on that might be too hot in the HF area.
The impulse averaging is like a semi anechoic measurement but with persistent room influence added. The right room curve is very personal but I also think that the RT60 of the room is a good guide as to what to expect will be added back from the room. When I compare the average vs single and view my RT60 graph the single measurement is basically the average with the RT60 based boost added. That boost from the reflectivity of the room will be added back when the speaker plays in the room so the difference will be less than you think.
If you have gone to the trouble of treating your room then your RT60 might be lower and more even. In that case you might prefer a target that is closer to flat. Or you might not
REW has had impulse averaging for a long time but the new betas make it easier with the vector averaging function. I didn't find the batch time aligning to work very well, I preferred to do that part by hand as a mismatch in the impulse timing will skew the high frequency results.
I am listening to a 1dB fall from 40Hz that is very similar to Wesayso's. So far I like it but the overall EQ is based on the first measurements so it isn't quite right just yet and too early to make any definitive conclusions on.
I have run my latest average measurements through DRC processing based on wesayso's sample template he posted with some changes. The differences between Left and Right average out quite nicely in these graphs. I have not listened to it yet and it is somewhat virtual and not a complete listening position measurement, but it looks promising.
This is left and right combined with a 6 cycle FDW, you can see how close to the minimum phase pass band it is. It looks pretty good I hope it sounds that way
Attachments

Thank God, the impulse average and the frequency average are getting closer now, using same smoothing for each individual measurements. I was confused with the earlier average comparison and how to deal with the difference between the two.
Of course, wesayso didn't use any kind of averaging earlier as he was doing single point measurements. Infact, REW didn't even support impulse averaging earlier and frequency averaging would have got him nowhere with DRC! So, it had to be single point impulse based EQ. I should have thought about that.
Of course, wesayso didn't use any kind of averaging earlier as he was doing single point measurements. Infact, REW didn't even support impulse averaging earlier and frequency averaging would have got him nowhere with DRC! So, it had to be single point impulse based EQ. I should have thought about that.
I'm not sure what I can say to convince you that floor to ceiling arrays have limited vertical dispersion and that this significantly reduces the influence of floor and ceiling reflections. That was one of the things that attracted me to the concept and so far I don't see evidence of significant floor or ceiling reflections in my measurements. If you think you can see them then please point them out.The boundary conditions of the array are of course important for the directivety
And reflections of floor and ceilling is only about 45 degrees or less of axis.
I would have a look at the floor reflection instead of the TV as of the mid band cancelling.
And even if it is not back wall reflection it is still important not to rise the frequencybands with most reflection as it will rise early reflections.
That is a nice document with plenty of good recommendations. 1.5 m would put the couch right in the middle of the room and reduce my listening distance which is not ideal with arrays. My room is a living room and not a dedicated listening room. The shape of the room lends itself to having the speaker facing the long wall and having greater distance behind the listening position but the house designer didn't have audio in mind and arranged the windows and power points to make that awkward. I won't be living in this house for that much longer so some of these things may change when I move.As of 1 m from back wall. EBU recomends 1.5 meter minimum from back wall.
Link the european brodcasting union spec of good listening conditions (in control rooms):
https://tech.ebu.ch/docs/tech/tech3276.pdf
It is quite some man hours of experience behind it.
Why do you think that?It seems like you are not so interested in early reflections at the ear but more total reflections in the area you are listening.
The area I have taken measurements in is not very wide, 1m from end to end. It covers the most likely ear positions of the seats on the couch. The idea is to get a correction that works well for the whole couch. I'm actually trying to base a correction on a semi anechoic response with the most persistent and non position dependent room issues included. To me this seems like the best compromise. Is there a method that you think works better?There is en difference between the EQing using wide area and neglecting first reflections that actually hits your ear.
That looks like an interesting read thanks for linking itAnyway (another topic), Harman has written a piece on the importance of a speaker looking good (as yours do) + other interesting measurement matters. Page 26.
Loudspeaker Industry Sourcebook
Link found here:
Claus Futtrup contributes to the Loudspeaker Industry Sourcebook
I did try my best to make the speakers look good so I'm glad I'm not the only one who thinks so.As you asked so nicely here is the Right Channel Single Centre ETC to 20ms.I forgot to ask if you would share a 20 ms ETC curve of one speaker. As I am specially interested in early reflections
I'm not sure of how to get that from REW, can you tell me which window and controls to set to get what you want?I would also be interested in a time windowed FFT from 1 ms to 10 ms to se the frequency content of the early reflections. (Where direct sound is time windowed out)
No problemAgain, thank you for your time and effort.
Regards Torgeir
Attachments

Thank God, the impulse average and the frequency average are getting closer now, using same smoothing for each individual measurements. I was confused with the earlier average comparison and how to deal with the difference between the two.
Of course, wesayso didn't use any kind of averaging earlier as he was doing single point measurements. Infact, REW didn't even support impulse averaging earlier and frequency averaging would have got him nowhere with DRC! So, it had to be single point impulse based EQ. I should have thought about that.
No the basic frequency average is higher in level than the individual so it has gone the other way.
Here is some more graphs to maybe show it more clearly. These are from my second set of measurements so 9 in the average.
The impulse average and single centre are quite similar, because of the more limited number of measurements.
1/24 Smoothing
6 cycle FDW
REW has had trace arithmetic for a long time so you could average two impulses together at a time but odd numbers wouldn't work. You can use A+B and then manually reduce the level or A+B/2. I think wesayso is still using the two at a time averaging rather than the vector function
Attachments


Directivety: You could measure the responce with the mic at the floor where the sound will hit the floor (and then will get to your ear. A rope will help finding the spot) then a measurement with the same radius midpoint speaker will give a clue of the directivety you are counting on.
ETC: Thank you.
Se there are some clutter at -8 dB within 1 ms.
Then there are some more at -10dB around 1 ms
And again some more at -12 dB around 5 ms.
Windowing normal time response and looking at the freq resp. will give a clue of the HF spectre of the reflections. So the trick is to start the windowing just before the reflections (as if they where the main lobe in the time responce)
The length of the window gives the frequency resolution, 1/T where T is the length of the window.
Fluid, Thanks for sharing.
Apparently the impulse response averaging is the more accurate method.
Two person, one using impulse average for FIR based EQ and another using average frequency response for IIR PEQ based EQ might come up with pretty different performance for the same apparent target curve, particularly below 300 as per your graphs.
Interesting. Guess who might be the sad one!
- Home
- Loudspeakers
- Full Range
- Full Range TC9 Line Array CNC Cabinet