
I've started building tube amps. Why fight the cosmos
You mean vacuum is the solution and dark matter?


I've started building tube amps. Why fight the cosmos
Attachments

how did you know i almost caught myself on fire?
You need to be careful around valves. The first computer I worked on was a late 1950s ALWAC-IIIE which consisted of vacuum tubes and a rotating drum memory. The voltage difference between rails was over 700V, with many amps behind them. Contact the rails at your peril.
This is not my first endeavor, but you are right, not to be toyed with. Hope to hold gm70 or gk71 amp by end of year. I want all 31 flavors of amps.
you have mere days!!
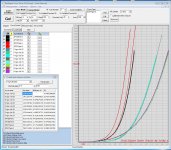
here some details about my N APT and P IXYS types.
N type is an old APT20M19JVR
P type an IXYS IXFN170N10
It seems that my P types tend to have a higher transconductance than the N types.....
At 25V and around 1.3A I got around 7.7S and 6.5S for the two P types.
5.0S for the two APTs
and for comparison 1.3-1.4S for the IRFs.
So the pucks have 5 times higher transconductance here.
So I am astonished how less transconductance the IRFs show. Combined with the 0.47R source resistors, nearly nothing left. So I understand better why Nelson combines so many.
I put a 0.05R source resistor in P2 with the lower transconductance and it lost around 2.4 S.
Are these data plausible?
And to have a good neg k2 phase how much S difference is necessary?
Attachments
Last edited:
Finally the light bulb turned on and the wise man has put his faith in the dumbness of picodumb. HahahaSo I am astonished how less transconductance the IRFs show. Combined with the 0.47R source resistors, nearly nothing left. So I understand better why Nelson combines so many.
I put a 0.05R source resistor in P2 with the lower transconductance and it lost around 2.4 S.
Are these data plausible?
And to have a good neg k2 phase how much S difference is necessary?
1) All of that is in the right ballpark
2) 20% to 35% difference is a good starting point, feel free to experiment. They're your ears that need pleasing.
Last edited:
here some details about my N APT and P IXYS types.
...
Are these data plausible?
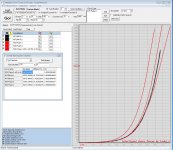
If I understand the plots correctly, the transconductances you are quoting comes from the line slopes between 2 Vgs values on each curve. The mistake might be that the same Vgs value pairs are used for each curve. What is really needed is the computation between pairs of Id values, such as 1.2A and 1.4A.
If I understand the plots correctly, the transconductances you are quoting comes from the line slopes between 2 Vgs values on each curve. The mistake might be that the same Vgs value pairs are used for each curve. What is really needed is the computation between pairs of Id values, such as 1.2A and 1.4A.
Hm, I looked also at the numerical data and computed them for the pair
1.6A-0.9A and the corresponding Delta Vgs.
With this hand method I got the same results as with the automatic calculation.
Understandable?
- Home
- Amplifiers
- Pass Labs
- F4 Beast Builders