Id opt for sticking with 2, 4, 8 or 16 measurements ")
Now why is it so cumbersome. Either do one thing and have useful data or do the other and have way less. I always opt for the thing that gets me what I need. I wouldn't even care if it made me run in circles as long as I know it gets me there.
I guess the average the response option was just meant as such, to average the response. The (A+B/2) is just a mathematical function. When using 8 measurements it would get you the average, and keeping phase info of that average in no time, what's the big problem? Is it really that much work? Moving the mic seems like way more work to me.
Measurement 1 and 2 -> (A+B/2)=AV1
Measurement 3 and 4 -> (A+B/2)=AV2
AV1 and AV2 -> (A+B/2)=AVS1
Measurement 5 and 6 -> (A+B/2)=AV3
Measurement 7 and 8 -> (A+B/2)=AV4
AV3 and AV4 -> (A+B/2)=AVS2
AVS1 and AVS2 -> (A+B/2)= Average of 8 measurements. No need to adjust SPL afterwards (Because of the "/2" part)
Just a few mouse clicks away after running around moving the mic.
If I ask you the question: what would you like to see at the listening position? What would be your answer?
Last edited:
My point was not that the averaging process isn't worth the trouble, or that I'm unwilling to invest time in this project (I'm six years into it already). It just seems a bit silly not to have the software make it as easy as possible to do something like average measurements while retaining phase information. That's the reason computers were invented, it seems to me---to simplify and speed up such tasks. So I've been assuming I just don't know the best way to use REW.
I'll look at the REW documentation and see if I can better understand why the phase gets lost with the "average" command. I expected average to do precisely what you wrote out, and so the phase information would still be there. Apparently it's doing something else. Probably I'm missing some detail that I would benefit from learning about.
Few
Why do you think phase matters? A lot of times I find polarity hardly matters with subs around the room in some measurements.
Are you confusing simplified textbook diagrams of pure sine tones with the reality of two largely phase independent music channels bouncing off your floor and walls? Have you considered what happens when you change chairs and are a few inches further from one speaker than the other? Or when a singer nods their head to one side?
B.
Last edited:
No I'm not confused. I'm using impulse and step responses as part of my method of measuring what the speakers are doing when listened to at various locations in the room. I've found the step response, in particular, to be very helpful when trying to determine how the sound from all the points along the tall tower sum at a given location. I need the phase to calculate the impulse and step responses.
I'm aware different folks have different ideas about how important phase is. I want speakers capable of approximately linear phase response so I can explore the question myself.
Of course there's also the fact that an impulse and white noise have identical flat magnitude spectra; they differ only in phase and sound quite different.
Few
For sure.No I'm not confused. I'm using impulse and step responses as part of...
But don't you have to nail down time of arrival first? Don't phase relationships change with each change of distance (angle, temperature, cat on the sofa......) from the source?
I have a highly skillful friend who says his Quad ESLs (63?) can produce square waves. Never achieved that with my ESLs, but seems amazing.
In truth, I always admire people who are into research fun even if it seems just a tangent goal to me. More power to 'em.
Ben
… distortion results are now more relevant. 2nd harmonic shows a peak of ~0.2% at 1.2 KHz, 0.6% at 310 Hz, and 1.24% at the 150 Hz crossover frequency I've been using. Looks like I should move that crossover up a bit to rely more on the woofer array at 150 Hz. No sign of a distortion peak at the 2.5 KHz kink in the magnitude response.
Congrats on persevering and getting your planar line sources up and running.

For best accuracy when measuring distortion with the swept sine method, you need to adjust the microphone preamp gain and/or soundcard input gain such that your signal peaks within 6dB of full scale. Not sure if you have zoomed in and looked at the “pre-impulses” generated for each of the harmonics…they are really tiny compared to the fundamental impulse. You need all the headroom you can get. I have experienced distortion levels changing as much as 2 orders of magnitude when a watchful eye was not kept on the soundcard input level.
It is highly possible that the distortion peak at 1.2kHz is caused by the response behavior at 2.5kHz. REW actually has some control settings for normalizing the distortion curves relative to the response level at the stimulus frequency, or at the harmonic. I attached a snapshot of the relevant REW documentation. If anybody is interested in further ready on the topic, you can download copies of the Temme paper and B&K Appnote here:
http://www.pearl-hifi.com/06_Lit_Ar...pers/How_To_Graph_Distortion_Measurements.pdf
https://www.bksv.com/media/doc/BO0385.pdf
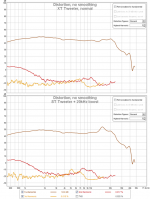
Actually, now that I think of it, I have a set of example measurements I took with an XT tweeter that may be of interested. I put them together to illustrate the differences between the 3 REW distortion plot options. Each attachment shows measured distortion with and without a 15kHz EQ peak inserted in the signal path.
Attachment #2 Plotting harmonic distortion without normalization allows you to see the fundamental response. You can also easily see peaks in the 2nd and 3rd harmonic at 7.5khz and 5 kHz respectively when 15kHz EQ boost is added. Note that there isn’t any accompanying distortion peak at 15khz since boosting at that high of a frequency doesn’t cause the voice coil to move outside its linear range.
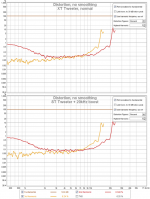
Attachment #3 Normalizing relative to the stimulus frequency and you get harmonics plotted in % with fundamental at 100%. It still looks like there might be some distortion issues at 5kHz and 7.5kHz. Notice there is a dip in the distortion at 15kHz since you are normalizing relative to a boosted stimulus response.
Attachment #4 Normalizing relative to the harmonic frequency and the distortion profiles look virtually identical with or without the 15kHz EQ boost. This verifies that the distortion peaks at 5kHz and 7.5kHz are due to the non-flat frequency response at the harmonic frequency rather than some localized distortion mechanism.
Attachments

If you can tell me the width and height of the radiating area of your planars, and the height of the 3 gaps between the 4 radiating areas, I can run some vertical polar comparisons between a continuous radiator and your 4 spaced radiators at a few distances. My experience with ESLs is that they nearly exactly match the finite line source behavior documented in Vanderkooy's paper, AES E-Library The Acoustic Radiation of Line Sources of Finite Length. Depending on the size of the gaps relative to the height of the planars, there might be some added "wrinkles" in the response that shift with position and frequency.… I'm sure some of what I'm seeing is from reflections but I think some of it may be inherent in the summing of the signals from different parts of the speaker. On the one hand the diaphragms are continuous, on the other hand there are three gaps separating the four drivers. I'm wondering how much those gaps are complicating my results.
Oh, also meant to ask, for your measurements at stepped distances back in post #87, where exactly was the mic placed height-wise relative to the 4 planars?
For best understanding of your planars and how to model their behavior in the room, a similar measurement with no LP on the midrange and no EQ other than the 50Hz HP would be helpful. I would recommend one set of measurements on the center axis of the 3rd planar from the floor, and another on the center axis of the arrary(ie the gap between the middle two planars”
Nice job tracking down sources of the spurious reflections.I've tracked down the reflections, I think….The felt really cleaned up the 6.5 KHz junk. I was even able to reinstall the grills, front and back, without the old 2.5 KHz problem reappearing.
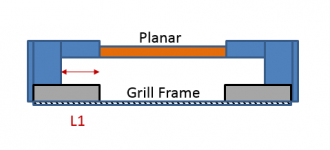
I’m not sure if the exact dimensions and layout of your rear grill frame, but if it is anything like the attached cross section view, it is possible the 2.5kHz issue is due to a 1/4Wave pipe resonance. For a 2.5kHz, L1 in the figure would be about 30mm when accounting for end effect of the “pipe”. Looking back at your measurements, the 2.5kHz feature always seemed to be a closely coupled peak/dip, which seems to jibe with response summation with a resonator which has a phase reversal going thru resonance.
Adding felt to the pipe cavity could damp it out nicely. Alternatively, when experiencing a similar grill frame related resonance on an ESL, I found that simply filling the cavity up with a piece of MDF solved the problem.
Hmmmm…had you re-measured distortion since removing the 2.5kHz problem?
Attachments
Bolserst, great to have you in on the discussion! Thanks for all the very helpful advice. I was not careful about input levels or even about knowing what the absolute SPL was when experimenting with the distortion measurements. I mostly wanted to make sure I knew how to get REW to provide them. Based on your explanation and examples, there's clearly more there than I realized so I'll read up, figure out how to do an absolute SPL calibration, and give it a more careful shot the next time I measure distortion. I should definitely check to see if my felt addition had any impact on the distortion above 1 KHz. I think of harmonic distortion as indicating nonlinearity and I'm not yet catching on to the idea that a reflection can lead to nonlinearity. More to learn, no doubt.
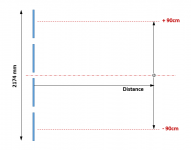
I've dimensioned a photo in the hope that it makes clear what's what. Let me know if anything needs some explanation. All dimensions are in mm. I'd be very interested to see what a model predicts. Is there anything Vanderkooy didn't publish on?!
I believe my stepping-back measurements were made with the mic centered on the second diaphragm, counting up from the bottom. Now that you ask, though, I don't think I made careful notes of that session. There's a slim chance the mic was from halfway up the tower.
Few
Attachments
I tried to track down the Vanderkooy article Bolserst cited but as a non-member of the AES I don't have access. The abstract certainly paints a gloomy picture:
I'm glad I built my speakers before being put off by the prediction! Still, I'm very interested to see what their calculations say about the radiation pattern. It would likely make it easier to interpret my own in-room measurements.
Few
"...It is found that a smooth flat frequency response both on and off axis requires a monopolar line source used in the extreme far field, which is impractical. In the near field the response becomes irregular, distance-dependent, directional, and not feasible to equalize. The dipolar line source does not appear to be useful for monitoring purposes."
I'm glad I built my speakers before being put off by the prediction! Still, I'm very interested to see what their calculations say about the radiation pattern. It would likely make it easier to interpret my own in-room measurements.
Few
All dimensions are clear, however I forgot to ask for distance from bottom of lowest planar to the floor, and from top of highest planar to the ceiling. These would be needed if we want to add in mirror reflections to the calculations. For a first pass, I just ran the array of 4 planars with no floor or ceiling.I've dimensioned a photo in the hope that it makes clear what's what. Let me know if anything needs some explanation.
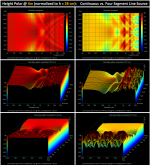
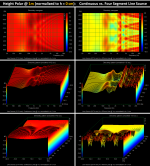
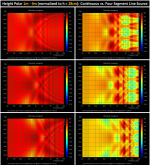
I wasn’t sure what type of visual you might like the best, so chose 3 that comparison on this first posting. Let me know what you like best and any additional plots can be trimmed down in size. My personal preference is the sonogram.
Attachment 1: Although the plots are labeled in degrees, the calculations were performed at a constant distance with height varying +/-90cm
Attachment 2 - 4: Height Polars @ 1m, 2m, & 4m with response normalized to h=0cm (ie center of array)
Attachment 5 - 7: Height Polars @ 1m, 2m, & 4m with response normalized to h=28cm (ie center of 3rd planar)
The continuous line definitely has less response variation with height.
The usual recommendation to listen in the middle third of the panel height looks about right...ripples staying < +/-3dB in that window.
I know right? It seems every time a topic peaks my interest I find he has published on it.Is there anything Vanderkooy didn't publish on?!
Attachments
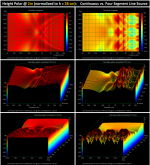

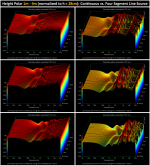
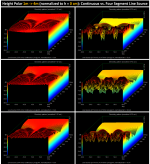
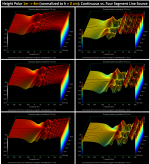
Here are some additional plots of the same data but arranged to see trends with distance for the 3 different formats:
Attachment 1 - 3: Height Polars distance trends normalized to h=0 for 3 different plot types.
Attachment 4 - 6: Height Polars distance trends normalized to h=28 for 3 different plot types.
Attachment 1 - 3: Height Polars distance trends normalized to h=0 for 3 different plot types.
Attachment 4 - 6: Height Polars distance trends normalized to h=28 for 3 different plot types.
Attachments
Hi All
The ideal line source should be floor-to-ceiling. In that way the reflections from the floor and ceiling make the line source look infinitely long. (Imagine that the floor and ceiling are mirrors).
A real line source that does not extend to the ceiling or is raised from the floor, or both, looks like an infinite line source with regularly spaced gaps in it. In this respect it behaves very much like a diffraction grating in the near field.
Now Wikipedia the Talbot effect...
"The Talbot effect is a near-field diffraction effect first observed in 1836 by Henry Fox Talbot. When a plane wave is incident upon a periodic diffraction grating, the image of the grating is repeated at regular distances away from the grating plane. The regular distance is called the Talbot length, and the repeated images are called self images or Talbot images. Furthermore, at half the Talbot length, a self-image also occurs, but phase-shifted by half a period (the physical meaning of this is that it is laterally shifted by half the width of the grating period). At smaller regular fractions of the Talbot length, sub-images can also be observed. At one quarter of the Talbot length, the self-image is halved in size, and appears with half the period of the grating (thus twice as many images are seen). At one eighth of the Talbot length, the period and size of the images is halved again, and so forth creating a fractal pattern of sub images with ever decreasing size, often referred to as a Talbot carpet."
Wikipedia has a nice picture of the Talbot carpet.
I can tell you from personal experience that a floor-to-ceiling line source has a very low WAF indeed.
So the real question is what is the trade-off between the mark-space ratio of the line source and the variations in SPL (e.g. expressed as amplitude of the ripples in the listening space)
regards
Rod
Wonderful! Very cool (and pretty as well!). Just to be sure I'm starting out on the right track, in each figure the left column shows three ways of viewing the response from a continuous line source and the right column shows one with panels and gaps like my towers. Do I have that right? I agree the sonogram is easiest to interpret. There's sure a lot of information packed into each figure. I'll need to stare at them for awhile to capture it all. The bottom line is clearly that the gaps are problematic. Of course there's not much I can do about them at the moment, but at least I can proceed armed with new knowledge.
Thanks so much for your efforts! When I get home I'll measure the height of the bottom of the lowest panel. The room has 10' ceilings so there's a ~2' gap above the top of the tower.
By the way, what did you use to create the simulations?
Few
Thanks so much for your efforts! When I get home I'll measure the height of the bottom of the lowest panel. The room has 10' ceilings so there's a ~2' gap above the top of the tower.
By the way, what did you use to create the simulations?
Few
Thanks for that, Rod. I had never encountered the idea of the Talbot effect even though I've worked with diffraction gratings for many years. The "carpet" looks like a fractal. Pretty neat.
So I guess I need to put my listening seat one Talbot length from the speaker and make sure my head height is the same as one of the panels. I'll then get the nearfield response!
...as long as I listen to monochromatic music outdoors.... Okay, so maybe that won't work.
Few
So I guess I need to put my listening seat one Talbot length from the speaker and make sure my head height is the same as one of the panels. I'll then get the nearfield response!
...as long as I listen to monochromatic music outdoors.... Okay, so maybe that won't work.
Few
Correct.… Just to be sure I'm starting out on the right track, in each figure the left column shows three ways of viewing the response from a continuous line source and the right column shows one with panels and gaps like my towers. Do I have that right?
I use Excel to crunch the numbers/summations from the Vanderkooy paper and a short VBA script to trundle through the varying parameters of interest(height, distance, angle, etc...) and output binary *.pir files that ARTA needs to make the pretty plots.what did you use to create the simulations?
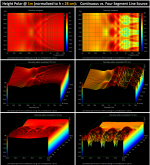
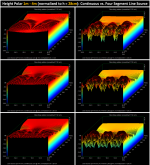
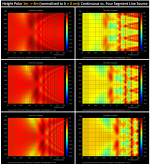
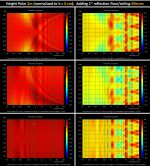
As golfnut mentioned, ideally you would like to have a floor-to-ceiling line source which will behave like an infinitely long line source with repetitions of any source gaps you have. Stepping our way to that ideal mirroring situation, I added just the first floor and ceiling mirror to the calculations with floor and ceiling placed exactly at the top and bottom of the line source). The first row shows the finite line response with no floor or ceiling mirrors from post#132. The 2nd row adds the first mirror from the floor. The 3rd row adds the first mirror from the floor and ceiling. You can easily see why floor to ceiling ESLs are desirable.When I get home I'll measure the height of the bottom of the lowest panel. The room has 10' ceilings so there's a ~2' gap above the top of the tower.
Adding the first mirrors to your spaced planars pretty much cleans up the undulations below 1kHz, but the issues above 1Khz will remain because of the gaps. I’m wondering if a carefully selected spacing with the floor and/or ceiling could help out (maybe 1/2 the planar-to-planar center spacing?) . I will play with that a bit once I hear back from you on what the actual gaps are.
Attachments
Thanks for the follow-up info. Very informative. I knew going in that truly floor-to-ceiling was the ideal; I also knew it wasn't going to happen with 10 foot ceilings (and a marriage). Construction details and second-guessing caused the gaps between drivers to expand beyond what I originally intended and your graphics make it clear the high frequency smoothness suffers as a result. A bit disheartening. Fortunately human perception seems to be pretty accommodating.
I don't have a good way to reduce the gaps without some serious rebuilding so that's not going to happen in the near future. I'll just take into account what you've demonstrated as I interpret my measurements. Clearly there's no point sweating 0.5 dB details at one height if other heights are going to exhibit much larger deviations. Maybe I can discern from your models which heights to include when averaging measurements. That would be a very helpful result.
If someone else decides to build some version of the drivers I've made I can probably suggest a few adjustments that would reduce the gaps between panels quite a bit. While I was working I didn't know whether I was wasting my time on something that was inherently flawed. Now that I know the end result has a lot of merit I can imagine DIYPlanarMagnetics 2.0 that get quite close to the ideal.
Bolserst, if you're willing to devote more time to this craziness and would like to update your models, the distance from the floor to the bottom of the bottom conductor is 170 mm. The distance from the top of the top conductor to the top of the speaker is 90 mm, and the ceiling is 570 mm above the top of the speaker (660 mm conductor to ceiling).
Thanks so much for all your assistance!
Few
It really is, especially at further listening distances where the room contribution tends to moderate the peaks and valleys in the direct signal.… Fortunately human perception seems to be pretty accommodating.
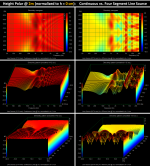
Got it, thanks! I should have some time tonight to roll those into the calculations.…the distance from the floor to the bottom of the bottom conductor is 170 mm. The distance from the top of the top conductor to the top of the speaker is 90 mm, and the ceiling is 570 mm above the top of the speaker (660 mm conductor to ceiling).
I’m guessing the results will be similar to those shown in post#137…some smoothing at the bottom end, not much change at the top.
I have had good luck using impulse summation from varying heights at a set distance to extract a smoothed or average response magnitude and phase for EQ guidance. In your case, I would expect a set of heights ranging from the middle of the gap between planars 2 & 3 up to the middle of planar 3 should work well. The resulting curve should be similar to the moving mic method, but with phase data. I will plan to post some examples of that with your setup at different measuring distances. From my experience, the curves for varying distances will be identical except for a small shift in the LF transition frequency.Maybe I can discern from your models which heights to include when averaging measurements. That would be a very helpful result.
Sounds good---or at least I hope it'll sound good. In any case, thanks.
By the way, I noticed in your reflection-free simulations that the response looks quite smooth right along the tower midpoint. For example, the top right sonogram in your most recent set (post #137) shows quite uniform response along the 0 degree axis. I'll be interested to see if my gated measurements show the same thing but I'll have to be sure to use appropriate equalization to test that out. I'm assuming that your model assumes (follow that?) that the speaker has flat magnitude response in the nearfield. Do I have that right? In other words, would flat response along the 0 degree axis mean the response at the distant measurement point mimics that in the nearfield? I've realized I'm not sure how dipole cancellation is taken into account in your model. Vanderkooy's equations have the built in, correct?
Few
Last edited:
- Home
- Loudspeakers
- Planars & Exotics
- DIY planar magnetic + open baffle woofer array