....THD simulations are useless.....
Still pretending you don't read my posts?
Belief in the accuracy of SPICE THD simulation viz a viz real measurements is indeed the domain of fools.
So far .....
Gentlemen,
Just for the sake of knowing where we stand:
1. Different simulation packages given an analyticaly solved signal (fundamental + selected values for harmonic magnitudes) do a decent job of evaluating THD with some departures which seem dependent on simulation setup (not surprisingly).
This holds even after processing the signal through an amplifier model with ideal active components.
2. Which then leaves the issue of ppm THD simulation accuracy on the accuracy and realism of device models.
Is this correct?
Rodolfo
Gentlemen,
Just for the sake of knowing where we stand:
1. Different simulation packages given an analytically solved signal (fundamental + selected values for harmonic magnitudes) do a decent job of evaluating THD with some departures which seem dependent on simulation setup (not surprisingly).
This holds even after processing the signal through an amplifier model with ideal active components.
Hi Rodolfo,
This holds for some simulators, but not all of them. I'm still waiting for a THD sim on a composite signal of ten sine sources (see post 3900) with LTspice and Cadence.
2. Which then leaves the issue of ppm THD simulation accuracy on the accuracy and realism of device models.
Is this correct?
Rodolfo
> correct?
I don't think so. The differences (see below) are too large to be attributed solely to deficiencies of the device models. There is already some evidence that something is fundamentally wrong with the FFT routines of Cadence (see post 3899). This has to be further investigated.
As for Bob's amp:
Code:
Post:   Simulator:   THD1k:
3824    LTspice     26.5ppm
3826    Cadence    259.6ppm
3826    MicroCap    26.8ppm
3844    Cadence     81.8ppm
3850    Cadence    190.6ppm
3863    Simetric   190.xppm
As for a composite input signal (10 sines)
with or without a synthetic amp included.
Code:
Post:  Simulator:   THD1k:
3900   MicroCap   26.55ppm
3912   Simetrix   26.55ppm
na     Cadence    still missing
na     LTspice    still missing
As for for another composite input signal:
Code:
Post:  Simulator:   THD1k:
3899   Cadence    FFT ~20% errors
3899   LTspice    correct
Cheers,
E.
As for a composite input signal (10 sines)
with or without a synthetic amp included.
Code:Post: Simulator: THD1k: 3900 MicroCap 26.55ppm 3912 Simetrix 26.55ppm na Cadence still missing na LTspice still missing
These are the cadence results. For all purposes, the composite input signal result is identical as with Simetrix and MicroCap.
If you allow me a personal comment, my lack of appetite for further significantly contributing to this topic is your attitude of "me against them". You seem to be more interested in proving anybody (companies, users, equipment manufacturers, etc...) not agreeing with your conclusions as "fools", "crap", etc..., and to prove your own simulation results as "foolproof", rather than genuinly (and in the DIY spirit) willing to investigate the limitations and properties of various simulation tools, and then drawing practical conclusions, helping others in aligning the simulation results.
Attachments
Last edited:
Hi Rodolfo,
This holds for some simulators, but not all of them. ....
Edmond,
As far as results posted taking into account proper context, direct analysis for a prefab 10 sines signal, there seems to be good agreement among simulators, only LTspice is still missing (any takers ...?
 ).
).On the other hand I find prety interesting inputting a clean wave to a synthetic nonlinearity so "measured" results form simulation can be checked against direct calculations. This is what magnoman proposed in post 3899 and hastened to make clear he is no expert at least with Cadence so ... takers ...?
.Of course Simetrix and Microcap should also have a place alongsaid in a final table:
----------------|LTSpice-----|Microcap----|Cadence---|Simetrix|
10 sines----|??-------------|26.55---------|26.57--------|26.55----|ppm
polynom----|OK------------|??--------------|[BAD?]-----|??---------|
Rodolfo
Last edited:
Simetrix 1kHz THD simulation difference sorted out
Hello Edmond
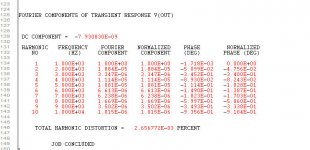
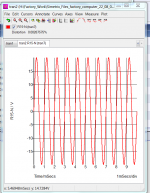
I determined the reason for the difference between my 1kHz THD figure done on Simetrix and those done on LTspice and MC9 and that was due to the models I used which I obtained from post 3850 supplied by Stinius his models are different to the ones used by Waly on post 3824. See the attached 2 files.
The THD figure is now 0.00267575% at 1KHz see attached plot. This now brings my results in line with LTspice and MC9 .
Stinius if you are reading this could you do your sims with the models in file marked Cordell Models_12_07_2010.txt .
Interestingly Bobs book sims (page 409-415) use older models and get worse THD performance. If you google "spice model mje243" you will get taken to Bobs book and on his web site the download "Spice Tutorial Examples.zip" example 19.7 uses the newer models with lower THD.
Regards
Arthur
Hello Edmond
I determined the reason for the difference between my 1kHz THD figure done on Simetrix and those done on LTspice and MC9 and that was due to the models I used which I obtained from post 3850 supplied by Stinius his models are different to the ones used by Waly on post 3824. See the attached 2 files.
The THD figure is now 0.00267575% at 1KHz see attached plot. This now brings my results in line with LTspice and MC9 .
Stinius if you are reading this could you do your sims with the models in file marked Cordell Models_12_07_2010.txt .
Interestingly Bobs book sims (page 409-415) use older models and get worse THD performance. If you google "spice model mje243" you will get taken to Bobs book and on his web site the download "Spice Tutorial Examples.zip" example 19.7 uses the newer models with lower THD.
Regards
Arthur
Attachments
Last edited:
Edmond,
[snip]
Of course Simetrix and Microcap should also have a place alongside in a final table:
----------------|LTSpice-----|Microcap----|Cadence---|Simetrix|
10 sines----|??-------------|26.55---------|26.57--------|26.55----|ppm
polynom---|OK-------------|??-------------|[BAD?]------|??--------|
Rodolfo
No problem, but I've no intention to sim all the polynomials Antonio has tried. We should standardize on only one them. Any suggestion?
Cheers,
E.
As for the polynomial, this is my suggestion:
Vin = 1kHz & 1V
Vout = Vin + a * ( Vin^2 + Vin^3 + Vin^4 ), where a = 1E-6.
Any objections?
I've run this polynomial and got THD = 1.038ppm
(with a = 1E-5 I got 10.38ppm, of course, what else?)
Scores till now:
Bob's amp:
Cheers,
E.
Vin = 1kHz & 1V
Vout = Vin + a * ( Vin^2 + Vin^3 + Vin^4 ), where a = 1E-6.
Any objections?
I've run this polynomial and got THD = 1.038ppm
(with a = 1E-5 I got 10.38ppm, of course, what else?)
Scores till now:
Code:
Simulator     LTSpice   Microcap    Cadence   Simetrix
10 sines        ??        26.55      26.57     26.55    ppm
polynom         OK         OK         BAD        ??
Bob's amp:
Code:
Post:   Simulator:   THD1k:
3824    LTspice     26.5ppm
3826    Cadence    259.6ppm
3826    MicroCap    26.8ppm
3844    Cadence     81.8ppm
3850    Cadence    190.6ppm   (using bad models)
3863    Simetric   190.xppm   (using bad models)
3927    Simetrix    26.8ppm
Cheers,
E.
After some more experimenting (and some help from a guy who's name is no longer welcomed on this forum), here's how to persuade PSPICE to provide the same THD results as the other simulators.
Rather than going for absurdly low max time steps (I tried as low as 10mS/(2^17-1), which still provided 82ppm as mentioned here, keep the max time step to 1uS and adjust the "Print output values in the file every (...)" parameter to 10mS/(2^14-1)=0.61038881767686015992187023133736uS. 10mS is the entire simulation period, while only the last 5mS (5 periods) are used for Fourier analysis ("Start saving data after (...)" parameter). The results are attached (_refined_ files), THD is now 26.96ppm.
Using 0.61038881767686015992187023133736uS as a max time step doesn't deliver (see the attachments, _step_ files); the THD result is 89ppm, not better than in the post quoted above, using an extremely small max time step.
According to that name (apparently this is also buried somewhere in the PSPICE documentation):
Using the above setup, I also tried the 17.9 schematic with the PSPICE default models for the devices. These models are not labelled as ON/MODPEX (but Motorola @1999), and they delivered the same THD of 190ppm as in the initial Simetrix results.
Now that the simulators are aligned (configuration wise), so the results delivered by the internal math are consistent, the big (and much more difficult) question is: lacking the opportunity to directly check (through measurements), which models to trust?
I should also mention I have no tried myself to scale the simulation parameters at other frequencies (like for determining THD @20KHz).
Rather than going for absurdly low max time steps (I tried as low as 10mS/(2^17-1), which still provided 82ppm as mentioned here, keep the max time step to 1uS and adjust the "Print output values in the file every (...)" parameter to 10mS/(2^14-1)=0.61038881767686015992187023133736uS. 10mS is the entire simulation period, while only the last 5mS (5 periods) are used for Fourier analysis ("Start saving data after (...)" parameter). The results are attached (_refined_ files), THD is now 26.96ppm.
Using 0.61038881767686015992187023133736uS as a max time step doesn't deliver (see the attachments, _step_ files); the THD result is 89ppm, not better than in the post quoted above, using an extremely small max time step.
According to that name (apparently this is also buried somewhere in the PSPICE documentation):
The Fourier analysis must be supplied with specified output variables using evenly spaced time points. The time interval used is "Print output values in the file every (...)", or 1% of the final time value TSTOP (if smaller), and a 2nd-order polynomial interpolation is used to calculate the output value used in the integration.
Using the above setup, I also tried the 17.9 schematic with the PSPICE default models for the devices. These models are not labelled as ON/MODPEX (but Motorola @1999), and they delivered the same THD of 190ppm as in the initial Simetrix results.
Now that the simulators are aligned (configuration wise), so the results delivered by the internal math are consistent, the big (and much more difficult) question is: lacking the opportunity to directly check (through measurements), which models to trust?
I should also mention I have no tried myself to scale the simulation parameters at other frequencies (like for determining THD @20KHz).
Attachments
Last edited:
Wally,
Thanks for the tips (I'll give it a try on Monday).
I did run another follow on case which nows has less interest but here goes:
I simplified my polynomial stage to v + 0.1*v^2, added a gain stage of 100 and a differencing amp to the input making for a 100% feedback infinite BW, loop gain =100. Again I could predict the distortion (at least the 2nd harmonic) with the feedback applied. The results lined up exactly with what I first observed.
Namely LTspice worked correctly, whereas for Cadence I had to reduce the max time step to .002us (very slow sim) to get the correct answer for the .four components.
I was still seeing errors in the measured Cadence FFT's peaks of ~20% (these errors vary with time step but seem to stay below 50%).
Wally, curious to see if the max print step also corrects the FFT peaks (from the plots you post I cant quite tell, as I say the error can be quite low ~10-20%) any chance you can measure the first 5 harmonics and compare to the .Four components, they should be identical.
FYI: I experimented some with max print time, but at first it simply seemed to track the max delta time.
For the max plot time why doesn't cadence ask for N instead: (2^17-1) in the form (2^N-1) ???
Many thanks
-Antonio
Last edited:
Wally, curious to see if the max print step also corrects the FFT peaks (from the plots you post I cant quite tell, as I say the error can be quite low ~10-20%) any chance you can measure the first 5 harmonics and compare to the .Four components, they should be identical.
FYI: I experimented some with max print time, but at first it simply seemed to track the max delta time.
For the max plot time why doesn't cadence ask for N instead: (2^17-1) in the form (2^N-1) ???
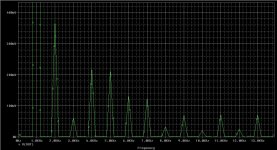
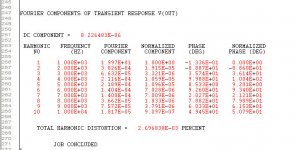
Here's the comparison between the spectrum peaks (I hope I made no errors, it's a manual process) and the FOUR components. Values are in uV, the third column is the relative error:
372.7 380.2 -2.01%
64.7 73.99 -14.36%
220.8 224.3 -1.59%
213.7 218.1 -2.06%
133.9 133.6 0.22%
126.2 130 -3.01%
32.7 21.7 33.64%
67.4 49.7 26.26%
20 22.2 -11.00%
Errors are relatively small for those components that contribute significantly to the THD.
To answer your question, I have no idea, using TSTOP/(2^N-1) as a print step is something that I inferred from the LTSPICE best practices. It could not be optimal, or valid in all cases, hence my comment about extrapolating the method.
EDIT: Sorry, I don't know how to format a table to improve the readability
Last edited:
noisy simulator
Walter (alias Waly, alias YWN),
So you finally figured out (with the help of syn08, who else) how to handle that piece of crappy and user unfriendly bloatware (btw, syn08 has written some part of it).
Anyhow CONGRATULATION!
>190ppm
So Cadence shipped their simulator with bad models. Everybody knows they are bad, so this is a bloody shame.
In the meantime you have wasted our precious time with noise from you as well as from your simulator.
Take it as a good lesson and do it never again, please!
As for your 'personal comment' in post 3925:
I beg your pardon! Forgotten who started to characterize my sims as useless, just random noise etc?
even when they were perfectly in accordance with real measurements.
Bon appétit
>I don't know how to format a table to improve the readability
See the BB code list, http://www.diyaudio.com/forums/misc.php?do=bbcode
Last edited:
So you finally figured out (with the help of syn08, who else) how to handle that piece of crappy and user unfriendly bloatware (btw, syn08 has written some part of it). So Cadence shipped their simulator with bad models. Everybody knows they are bad, so this is a bloody shame. In the meantime you have wasted our precious time with noise from you as well as from your simulator.
If you allow me a personal comment, my lack of appetite for further significantly contributing to this topic is your attitude of "me against them". You seem to be more interested in proving anybody (companies, users, equipment manufacturers, etc...) not agreeing with your conclusions as "fools", "crap", etc..., and to prove your own simulation results as "foolproof", rather than genuinly (and in the DIY spirit) willing to investigate the limitations and properties of various simulation tools, and then drawing practical conclusions, helping others in aligning the simulation results.
QED
Yet another misconception
Now that is clear that you cannot simulate THD below a certain level is a misconception and belongs to the realm of fantasy, let's talk about the next misconception:
AC analysis of loop gain - that's the type of analysis where simulators are shining.
Oh really?
As a matter of fact, AC analysis is much more prone to errors. This is because parasitic capacitances, inductances etc of components, leads and PCB traces are ill modeled or not modeled at all.
In case of THD simulations these parasitics have not much impact, as the frequencies of interest are limited to a few hundreds of kHz.
However, in case of an AC analysis (of a Miller loop, a BJT triplet or a MOSFET OPS) frequencies of interest extent to 10 to 100MHz. In this region parasitics have a far larger impact on the accuracy of the simulation. Just under these circumstances we need reliable results from a sim, as the stability of the amp is at stake.
I know of examples where the sim looks all right, and in real life the OPS exploded due to HF oscillations.
Bottom line: When investigating stability don't rely on AC sims alone, also use common sense and/or make use of proven techniques.
Cheers, E.
Last edited:
Now that is clear that you cannot simulate THD below a certain level is a misconception and belongs to the realm of fantasy, let's talk about the next misconception:
AC analysis of loop gain - that's the type of analysis where simulators are shining.
Oh really?
As a matter of fact, AC analysis is much more prone to errors. This is because parasitic capacitances, inductances etc of components, leads and PCB traces are ill modeled or not modeled at all.
In case of THD simulations these parasitics have not much impact, as the frequencies of interest are limited to a few hundreds of kHz.
However, in case of an AC analysis (of a Miller loop, a BJT triplet or a MOSFET OPS) frequencies of interest extent to 10 to 100MHz. In this region parasitics have a far larger impact on the accuracy of the simulation. Just under these circumstances we need reliable results from a sim, as the stability of the amp is at stake.
I know of examples where the sim looks all right, and in real life the OPS exploded due to HF oscillations.
Bottom line: When investigating stability don't rely on AC sims alone, also use common sense and/or make use of proven techniques.
Cheers, E.
Hi Edmond,
You are right here, but the question is what values to use for parasitic capacitances and inductances and where to put them. I am not good in that area. I do AC analysis and then build the amp, connect to my test power supply(with current adjustment limiter) and look with oscilloscope for the oscillations or excess heat. In most cases I need to change very litle comparing with the simulation.
dado
Hi Damir,
>the question is what values to use for parasitic capacitances and inductances and where to put them
To get some idea of what values and where to put them, please have a look at this article for example: Analog Devices : Analog Dialogue : PCB Layout
Cheers,
E.
>the question is what values to use for parasitic capacitances and inductances and where to put them
To get some idea of what values and where to put them, please have a look at this article for example: Analog Devices : Analog Dialogue : PCB Layout
Cheers,
E.
Multisim THD figures are still missing.
Perhaps MagicBox is willing to jump in?
Cheers,
E.
Sure,
I just need a heads-up on which schematic / models to use and number of harmonics at which freq. to yield FFT results.
- Home
- Amplifiers
- Solid State
- Bob Cordell Interview: Error Correction