Vikash said:Ok, great. I'll have 'em done asap and let you know the results. Will see what can be done with them after I get them in my hands.
Were these ones broken in at all? I like to crank them hard for a few days before measuring usually.
Not even opened I'm afraid. Maybe you could just abuse them with some speed garage for 20mins ;-)
Drivers measured straight out of the box:
Not very consistent, but not out of the ordinary either.
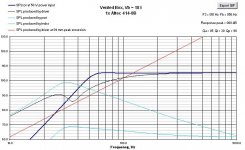
Attached is the FR measurement in a sealed 240mm cubed enclosure (13.82 litres) using Driver A. The FR is quite well behaved and extends to 4k before a smooth drop off. I've also shown the modelled response based on the measured T/S to compare.
The drivers are being run-in now and I will measure again after a couple of days.
Code:
		Fs	VAS	Qts	Qms	Qes	Re	Sd
Driver A	54.9	13.28	0.442	3.827	0.499	3.2	131.8
Driver B	45.2	17.68	0.393	3.566	0.441	3.2	131.8
Not very consistent, but not out of the ordinary either.
Attached is the FR measurement in a sealed 240mm cubed enclosure (13.82 litres) using Driver A. The FR is quite well behaved and extends to 4k before a smooth drop off. I've also shown the modelled response based on the measured T/S to compare.
The drivers are being run-in now and I will measure again after a couple of days.
Attachments
Hi Vikash,
Great work! It's nice to see such an ideal frequency response. I'll have to try them as mid/basses in a 2-way or 2.5-way speaker project.
Your table is puzzling because of the offset headings
But from memory I think your FS (on one of them at least), VAS and QTS are actually not too far from what I measured! This is splendid because I obviously didn't put too much faith in my first speaker measurements.
Displays fine in FF and IESimontY said:Your table is puzzling because of the offset headings

The smooth rolloff could make for an easy tweeter integration in a 2-way. Infact I have some tweeters lying around which might work here...
FYI Unibox reckons 88.4db efficiency 1W 1m, and models well in a ported enclosure of 18 litres tuned to 56Hz. F3 of 50Hz.
Attachments
Strange, the table does indeed work in my FF, but not my IE!
Anyway... yes a 2 way would surely be easy to get a good result from.
Will running-in shift down that optimal tuning frequency and F3?
It doesn't look like my isobaric box is stupidly far off does it? Maybe just a little detuned.... (no harm in that I don't think)
Anyway... yes a 2 way would surely be easy to get a good result from.
Will running-in shift down that optimal tuning frequency and F3?
It doesn't look like my isobaric box is stupidly far off does it? Maybe just a little detuned.... (no harm in that I don't think)
There will be a slight difference after run in for sure. How much I don't know, but more importantly since the run changes compliment each other (Fs and Qts go down, VAS goes up) the modelled response is not usually that different anyway. I just like to be thorough
Also I used a cubed enclosure that was lying around to take the FR . I'm not sure how measursable the effects of standing waves are, but the FR might be smoother once run in (skeptical) and in a proper enclosure
Also I used a cubed enclosure that was lying around to take the FR . I'm not sure how measursable the effects of standing waves are, but the FR might be smoother once run in (skeptical) and in a proper enclosure
T/S after 48 hours break-in:
The drivers show little relative T/S changes between pre/post break in. Certainly less than the consistency between drivers.
Attached is the FR of both drivers (measured at the same distance!).
Code:
Description	Fs	VAS	Qts	Qms	Qes	Re	Sd
Driver A Pre	54.9	13.28	0.442	3.827	0.499	3.2	131.8
Driver A Post	50.8	14.94	0.411	3.815	0.461	3.2	131.8

Driver B Pre	45.2	17.68	0.393	3.566	0.441	3.2	131.8
Driver B Post	43.2	19.39	0.376	3.657	0.419	3.2	131.8
The drivers show little relative T/S changes between pre/post break in. Certainly less than the consistency between drivers.
Attached is the FR of both drivers (measured at the same distance!).
Attachments
Hi Vikash,
Thanks for that. Very nice graph. It shows if u wanted to make anything really good with these drivers you'd really have to measure each one!!
I will model an average of the results, maybe even including my results, in WINISD and see how the box I made looks..
Simon
Thanks for that. Very nice graph. It shows if u wanted to make anything really good with these drivers you'd really have to measure each one!!
I will model an average of the results, maybe even including my results, in WINISD and see how the box I made looks..
Simon
richie00boy said:There seems to be quite a difference between drivers! Nice one Vikash and keep us informed Simon.
Yeh, and I will do mate. One of the drivers we used to make floorshakers with had two cones

I mean, really, we pulled one off and there was another. Wonder what *its* ts params were like!!

"Eastern" manufacturing eh...

- Status
- This old topic is closed. If you want to reopen this topic, contact a moderator using the "Report Post" button.
- Home
- Loudspeakers
- Multi-Way
- Augmenting the bass range of my speakers (inc. bi-amping)