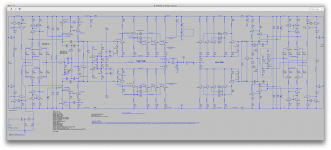
I was trying again to get the elektor based bridge to work, but this is just not happening.
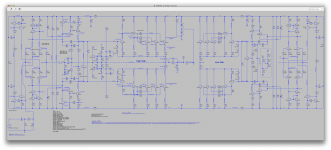
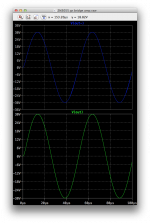
If I power both sides normally with a dual supply but keep them uncoupled, with the low side input(s) taken straight from the high side, they are in phase and both working properly.
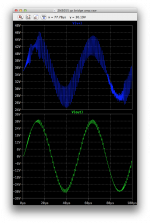
Once coupled and with the single supply, there are wild oscillations on the rails and that makes the high side oscillate too.
I tried changing the ratio on the coupling network that takes the feedback signal to match the feedback network on the high side, but that doesn't change anything, it won't work as a bridge.
I made sure I disabled completely the protection circuitry that was there before, so no interference can come from that.
Weirdly, when coupled, the output is at the same level as when not coupled, about 30V peak.
I'm not sure what the 3k56 role in the coupling network is, perhaps it requires adjustment. It seems to me the 33k /3k3 ratio, taking the high side's feedback signal, isn't working for this set up, which is why I figured I'd try matching that to the high side's feedback ratio.
The vi limiter that I'm working on (kiwanuka's fig 41) should be suitable for either the elektor or the "john ellis" version with the same values. I would like to test/simulate it on both bridges, but for now, when it's finally calculated, I'll only be able to test it on john's bridge.
Can someone think of how this bridge can be made to work right? There is no point in making a prototype if it doesn't even work in simulations.
If I power both sides normally with a dual supply but keep them uncoupled, with the low side input(s) taken straight from the high side, they are in phase and both working properly.
Once coupled and with the single supply, there are wild oscillations on the rails and that makes the high side oscillate too.
I tried changing the ratio on the coupling network that takes the feedback signal to match the feedback network on the high side, but that doesn't change anything, it won't work as a bridge.
I made sure I disabled completely the protection circuitry that was there before, so no interference can come from that.
Weirdly, when coupled, the output is at the same level as when not coupled, about 30V peak.
I'm not sure what the 3k56 role in the coupling network is, perhaps it requires adjustment. It seems to me the 33k /3k3 ratio, taking the high side's feedback signal, isn't working for this set up, which is why I figured I'd try matching that to the high side's feedback ratio.
The vi limiter that I'm working on (kiwanuka's fig 41) should be suitable for either the elektor or the "john ellis" version with the same values. I would like to test/simulate it on both bridges, but for now, when it's finally calculated, I'll only be able to test it on john's bridge.
Can someone think of how this bridge can be made to work right? There is no point in making a prototype if it doesn't even work in simulations.
Attachments
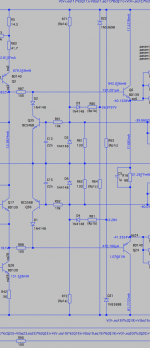
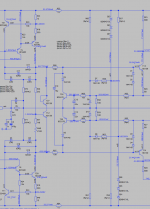
Here is The limiter installed into john's bridge. I picked arbitrary zeners, because I don't know yet what voltage they need to be. I put values to try out, but until properly calculated, I can't be sure it'll work right.
I haven't yet been able to plot the soa, load line and protection locus, so I can't even try to calculate anything. I've been trying to plot things in mathcad, but couldn't do it any better than with excel. I've never done any graphs with excel, so I need help figuring that out.
I haven't yet been able to plot the soa, load line and protection locus, so I can't even try to calculate anything. I've been trying to plot things in mathcad, but couldn't do it any better than with excel. I've never done any graphs with excel, so I need help figuring that out.
Attachments
Download Bensen's SOA spreadsheet.
I'd love to, but I don't know where to find it.
Was that the file called "SOA Calculation BJT OPS"?
I have that, and it does plot an soa chart, on a log scale. I'll try to understand how this works, but I may not be able to deal with that vba scripting in excel and making a linear plot may require a bit more know how in excel than I have.
I have that, and it does plot an soa chart, on a log scale. I'll try to understand how this works, but I may not be able to deal with that vba scripting in excel and making a linear plot may require a bit more know how in excel than I have.
I was just looking at datasheets for the 3055 and there is one thing that I'd like some info about.
The Vcer is given as 70V, and I don't understand what they mean by RBE=100ohms there. Does this mean when there is a 100 ohms resistor between its base and emitter the Vce sustainable goes up a bit from 60V?
And seeing that they mention Ib=0 with Ic=200mA for the Vce0, that doesn't make sense to me, as how could there be 200mA Ic if Ib is at 0 ???
With a resistor between base and emitter (which is normal operation in one of these amps) collector-base leakage current has a shunt path instead of all going into the base and causing collector current. So you get less Ic with Ib=0 (your other concern).
That spec (200mA) is set so high that even a really leaky device passes. Early devices probably had enough leakage current that this was a problem.
That spec (200mA) is set so high that even a really leaky device passes. Early devices probably had enough leakage current that this was a problem.
Was that the file called "SOA Calculation BJT OPS"?
I have that, and it does plot an soa chart, on a log scale. I'll try to understand how this works, but I may not be able to deal with that vba scripting in excel and making a linear plot may require a bit more know how in excel than I have.
Log plots are useless for deriving a linear VI locus. The maths to convert from log to linear is straightforward.
Ic=k(Vce)^n where
n = (logy1-logy2)/(logx1-logx2)
k = y1/(x1^n)
so draw a table of Vce, then using Excel derive their respective Ic's from the above equations. Hence the Vce, Ic data to create the linear graph is established. You can do this for each pulse graph given, and then derate each for your desired temperature.
y1,x1,y2,x2 are the break points of the SOA plot on the log log graph. Usually two are sufficient, the power section, and the secondary breakdown section; mosfets only need one.
Brian.
With a resistor between base and emitter (which is normal operation in one of these amps) collector-base leakage current has a shunt path instead of all going into the base and causing collector current. So you get less Ic with Ib=0 (your other concern).
That spec (200mA) is set so high that even a really leaky device passes. Early devices probably had enough leakage current that this was a problem.
Would that mean that the breakdown is actually a little higher in real use? since a resistor is almost always used in the circuits?
Bensen's spreadsheet has a link to David Eather's artcile.Was that the file called "SOA Calculation BJT OPS"?
I have that, and it does plot an soa chart, on a log scale. I'll try to understand how this works, but I may not be able to deal with that vba scripting in excel and making a linear plot may require a bit more know how in excel than I have.
Unfortunately the website has been re-arranged so you will have to do a bit of searching, but it is still there and still for free.
Read David Eather. He explains what the SOA is and gives all the calculations and how to extract the required info from the datasheet.
Log plots are useless for deriving a linear VI locus. The maths to convert from log to linear is straightforward.
Ic=k(Vce)^n where
n = (logy1-logy2)/(logx1-logx2)
k = y1/(x1^n)
so draw a table of Vce, then using Excel derive their respective Ic's from the above equations. Hence the Vce, Ic data to create the linear graph is established. You can do this for each pulse graph given, and then derate each for your desired temperature.
y1,x1,y2,x2 are the break points of the SOA plot on the log log graph. Usually two are sufficient, the power section, and the secondary breakdown section; mosfets only need one.
I'm trying to make sense of all this and starting from your sheet. That sheet refers to some external macro that it can't find and I can't see how the plot is drawing the curves. I can see at least that those plots aren't drawn directly from equations but rather point to point from a table drawn from the equations. I am working on drawing a plot now. This will require verification.
Bensen's spreadsheet has a link to David Eather's artcile.
Unfortunately the website has been re-arranged so you will have to do a bit of searching, but it is still there and still for free.
Read David Eather. He explains what the SOA is and gives all the calculations and how to extract the required info from the datasheet.
To make sure, I'm attaching the sheet that I found. This one has a couple of links in it, but one is to the forum and the other to leach's site. So perhaps I don't have the right one, or not the latest.
I am reading David Eather's paper. The thing is, there is more to it than figuring out the maths, I need to figure out excel as well.
Attachments
Very good amp based with 2n3055/2j2955
Here is an complete excellent audio amp based with 2n3055/2j3955: http://www.diyaudio.com/forums/solid-state/254701-two-audio-schematics-comment.html
enjoy!!")

Here is an complete excellent audio amp based with 2n3055/2j3955: http://www.diyaudio.com/forums/solid-state/254701-two-audio-schematics-comment.html
enjoy!!
Last edited:
I'm still wrestling with excel's chart feature and it's really not as easy as it should be. Not intuitive and looking for tutorial or explanations that pertain exactly to what I need has not been fruitful. The tutorials that I found don't show what I need and couldn't find the answers to my questions.
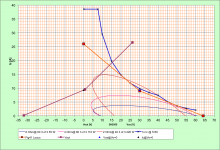
Anyway, after a lot of poking around and trying things, I managed to go around the error from a missing macro and use pingrs's chart to make a new one simplified for clarity (attached).
Having read in M. Kiwanuka's paper that the Ic=0 point on the locus, which intercepts the Vce axis, should be above 2Vcc to prevent premature limiting. This puts that point well above the 60V Vce0 of the 3055, but we've been planning for rails at 35V anyway, which obviates screening the 3055s for higher second breakdown.
I tried placing that point at 74V, and it brings up the locus well into the "scary" area of second breakdown. So that brings the question, of how much that area would move up when choosing the higher breakdown parts.
I brought it back down to 64V on that plot attached, so it's just grazing the limit, however that may not be the way to go because of the mentioned premature limiting.
Having the soa, the load lines and the locus on the same chart also shows that the high current area of the soa is never even used, while the knee point in the locus is in a "tight" spot, which not only is close to the soa limit, but more importantly is rather close to the load line for 4 ohms as well.
We must disregard the load line for 8homs, as that will never be the case, being bridged and each side always seeing 4ohms. The 4ohms load line, although plotted for 60 degrees reactive, is well within the soa and protection locus, however that doesn't account for the lower speaker impedance encountered in reality, as it could drop to some 2 ohms, possibly lower at certain frequencies.
It doesn't take much to see that the 2 ohms load line that is plotted, at 40 degrees only, is going out not only of the soa, but also above the protection locus, so that would mean a "normal" 4ohms load, if it is reactive enough, when its impedance drops at its lowest, will surely trigger the limiter, no matter how high we place that "point A" (where it's not used).
This also obviously means that if the bridge is loaded at 2ohms, it would certainly trigger the protection well before reaching full power.
Logically, if the limiter does limit the dissipation as it's supposed to, and sticks to the locus as we calculate, the amp should survive any abuse, either from a short or overload by over-driving or over-loading.
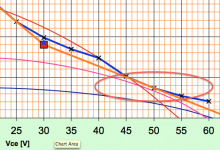
I made a closer snapshot of the area on the plot where I have concerns (area circled), where the locus is so close above the 4ohms @ 60 load line and also grazing the soa (blue curve).
I think its' quite possible that due to this tight arrangement, when the 4ohms load actually drops some, if it is reactive enough, there could be limiter action, which would be in the "normal" use of the amp.
I tried the 4ohms @ 45 load line, which drops quite a bit and leaves more headroom, but since it won't always be 4ohms and above, it will be a matter of how reactive the load is if the protection triggers or not. This would be at full power anyway, so of course at lower power it should be fine.
Now that I plotted that locus, I will make the limiter calculation stuff...
Anyway, after a lot of poking around and trying things, I managed to go around the error from a missing macro and use pingrs's chart to make a new one simplified for clarity (attached).
Having read in M. Kiwanuka's paper that the Ic=0 point on the locus, which intercepts the Vce axis, should be above 2Vcc to prevent premature limiting. This puts that point well above the 60V Vce0 of the 3055, but we've been planning for rails at 35V anyway, which obviates screening the 3055s for higher second breakdown.
I tried placing that point at 74V, and it brings up the locus well into the "scary" area of second breakdown. So that brings the question, of how much that area would move up when choosing the higher breakdown parts.
I brought it back down to 64V on that plot attached, so it's just grazing the limit, however that may not be the way to go because of the mentioned premature limiting.
Having the soa, the load lines and the locus on the same chart also shows that the high current area of the soa is never even used, while the knee point in the locus is in a "tight" spot, which not only is close to the soa limit, but more importantly is rather close to the load line for 4 ohms as well.
We must disregard the load line for 8homs, as that will never be the case, being bridged and each side always seeing 4ohms. The 4ohms load line, although plotted for 60 degrees reactive, is well within the soa and protection locus, however that doesn't account for the lower speaker impedance encountered in reality, as it could drop to some 2 ohms, possibly lower at certain frequencies.
It doesn't take much to see that the 2 ohms load line that is plotted, at 40 degrees only, is going out not only of the soa, but also above the protection locus, so that would mean a "normal" 4ohms load, if it is reactive enough, when its impedance drops at its lowest, will surely trigger the limiter, no matter how high we place that "point A" (where it's not used).
This also obviously means that if the bridge is loaded at 2ohms, it would certainly trigger the protection well before reaching full power.
Logically, if the limiter does limit the dissipation as it's supposed to, and sticks to the locus as we calculate, the amp should survive any abuse, either from a short or overload by over-driving or over-loading.
I made a closer snapshot of the area on the plot where I have concerns (area circled), where the locus is so close above the 4ohms @ 60 load line and also grazing the soa (blue curve).
I think its' quite possible that due to this tight arrangement, when the 4ohms load actually drops some, if it is reactive enough, there could be limiter action, which would be in the "normal" use of the amp.
I tried the 4ohms @ 45 load line, which drops quite a bit and leaves more headroom, but since it won't always be 4ohms and above, it will be a matter of how reactive the load is if the protection triggers or not. This would be at full power anyway, so of course at lower power it should be fine.
Now that I plotted that locus, I will make the limiter calculation stuff...
Attachments
Anyway, after a lot of poking around and trying things, I managed to go around the error from a missing macro and use pingrs's chart to make a new one simplified for clarity (attached).
QUOTE]
What macro do you mean? There is no missing macro,as far as I am aware. All the data you need is there.
Brian.
What macro do you mean? There is no missing macro,as far as I am aware. All the data you need is there.
Attaching a snapshot of the error popup.
I'm working on making a sheet for the fig 41 implementation, and for clarity, we don't need to have all of the soa curves there, they are overcrowding the lower right area where we need to see better what's going on.
Eventually for an amp that's really up to "any" task and handle all the abuse possible without hampering the normal operation, I think it will be necessary to think about making a 4 pairs version, so it can be used as a bridged bridge without issues. And I guess when used as a bridged bridge, it would be better if the load is 16 ohms, which would keep each half bridge loaded at 4 nominal. And since a bridged bridge has such a huge amount of power available, this would still be quite significant on 16 ohms loads.
If powering a big sub, in an active configuration, with the filtering done ahead and not at the speaker, the amp would be looking at an inductive only load, and I'm not sure how reactive the subs can be quantitatively, hoping they don't go above 40 or perhaps 45 degrees and the speaker's impedance curve doesn't drop too low.
Working with those sheets with reactive load lines against soa charts is an eye opener and shows how bad speakers can be for amps, and also how a limiter can really be intrusive if there isn't a large enough amount of headroom.
I think that once we have finalized the 3055 grounded bridge and it works properly, it will be interesting to try it with 2N3773s (increasing the rails a bit).
Attachments
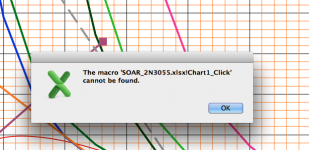
I see your error message, thanks, but it doesn't appear in the original on my P.C.,nor does it happen on another P.C. I copied it to. Has it anything to do with using a Mac? Also, if you can't edit any component values, there is something seriously amiss. I haven't locked any of the macro.
Anyway, I'll attach the original, maybe others can elucidate.
As you say, the VI limiter values don't apply to your case now, since you're using Fig 41. I can send a macro for that, if you wish, but given your difficulties, it might not help.
Brian
Anyway, I'll attach the original, maybe others can elucidate.
As you say, the VI limiter values don't apply to your case now, since you're using Fig 41. I can send a macro for that, if you wish, but given your difficulties, it might not help.
Brian
Attachments
I see your error message, thanks, but it doesn't appear in the original on my P.C.,nor does it happen on another P.C. I copied it to. Has it anything to do with using a Mac?
I don't think it would be a mac related issue. I would lean more in the direction of something that you have, external to the sheet and that gets called without you knowing it because it's there and I don't have it on my end. If you pass that same file along to other machines without any other related file and it works there, then perhaps it's something that's present among those machines but not on mine. Then if that is actually the case, then it may be that there are some resources present in office on windows but not on the mac.
Would be good to find out.
Also, if you can't edit any component values, there is something seriously amiss. I haven't locked any of the macro.
The thing is, the component values are in yellow bg cells and they're values and not formulas, so I can change them, but they're not calculated automatically.
Something isn't right there maybe.
Anyway, I'll attach the original, maybe others can elucidate.
Great. I'll see how this one works.
As you say, the VI limiter values don't apply to your case now, since you're using Fig 41. I can send a macro for that, if you wish, but given your difficulties, it might not help.
Anything will help, and I am making progress in handling excel a bit, although not good enough yet to create those nice charts as yours.
And the other issue that I have is to solve simultaneously those equations. I've been laying them down, and even tried doing that in mathcad, but I'm no better at mathcad than at excel, plus the mathcad version that I have access to is prime 2.0 and apparently it doesn't have the feature to allow simultaneous solving, so I'm stuck with that.
At least for now, I have determined a possible break point for the fig 41 locus, at Vce=30.9V, which allows using 3 30V zeners on each side, and at Ic=9A and the point A Ic lowered to 25A, so the locus doesn't encroach too much out of the soa (de-rated). We don't really need much of the low Vce and high Ic area of the soa, as all of the load lines are below 15A, however the area of concern is at low Ic and high Vce below the second breakdown critical zone.
That's why I was wondering about the locus crossing the Vce axis above 2 x Vcc.
Michael is specific on that point, that the locus must cross the Vce axis above 2 x Vcc to prevent spurious activation. In our case, that would be above 70V, but how much above do we need to go?
Having plotted a locus with the crossing at 74V, I can see that it rises above the soa in the bad area of second breakdown, but that is also something that I wanted to elucidate: What would the soa (de-rated) look like in that area for screened 3055s that can stand over 80V Vce???
We can't avoid the total power dissipation capacity, however a part that can withstand a higher Vce shouldn't de-rate quite as much in its second breakdown area, but how much? Perhaps enough so we can place the locus as it should.
I'm getting much closer to getting this done now, and since I'm stuck not being able to solve the maths yet, I am working on the pcb with eagle for the prototype.
This latest sheet is giving me the same missing macro error, so then it may be that something present on the windows based office may not be present with the mac version.
I put that fig 41 limiter in place in the simulation, although not all the values are calculated yet, at least the zeners and their biasing should be ok, unless the 30V needs to change, but it seems unlikely.
There is one thing that I've been wondering though. About the bias spreader, which should be thermally coupled with the pre-drivers only. Having tried a few implementations and with the issue of the lowish (~400mV) Vbe of the BD139/40, there are arrangements to avoid, as they don't "pinch" the spread enough to lower the bias in a suitable range. I tried keeping 2 transistors in the spreader in view of coupling them by pairs with the pre-drivers, but this may not even be needed.
Here's my idea: Why not making the bias spreader with a single BD139 and couple it with both pre-drivers, with the bias spreader transistor in sandwich between the 2 pre-drivers? one single screw could hold all 3 parts together, and we can put the plastic sides of the pre-drivers on the inside, touching the spreader, so no isolation would be needed, and a little thermal paste would be a good thing...
Does this sound ok?
Attachments
- Home
- Amplifiers
- Solid State
- Amplifier based on 2N3055