Hi rankot,
well I have still the same problem than I mentioned in June...looking for a satisfying solution.
I wrote an email to Dmitry (who invented his Model Paint Tool) if he perhaps would enhance his tool with my tube spice approaches, but he even didn't answer...
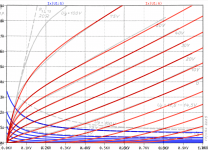
So, I'm still plotting my graphs with LTspice, overlaid with semitransparent Datasheet curves - works, but is inconvenient.
I'm open for any other solution that works faster!
well I have still the same problem than I mentioned in June...looking for a satisfying solution.
I wrote an email to Dmitry (who invented his Model Paint Tool) if he perhaps would enhance his tool with my tube spice approaches, but he even didn't answer...
So, I'm still plotting my graphs with LTspice, overlaid with semitransparent Datasheet curves - works, but is inconvenient.
I'm open for any other solution that works faster!
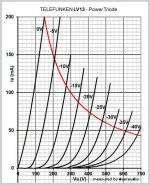
I'm looking for the LV-13 spice model.
Deutsche Militärröhren und Fassungen - LV13
http://www.jogis-roehrenbude.de/Roehren-Geschichtliches/Mil-Roeh_Fassg/LV13/LV13.pdf
Hi euro21
I have a just born LV13 LTspice model for you!

The problem is: There are no traces for negative Vg available in the web. So the parameter kp, which mimics the important island effect, has to be guessed.
If you perhaps own this tube: Would it be possible to measure at which Grid voltage the plate current reaches 60mA @ Vp=500V?
That would help a lot to set a suitable value for kp.
all the best, Adrian
Attachments
Attachments
Hi euro21,
wow, a hole bundle of curves - thats much better than just one measured point!
The measured sample of your friend seems to have burned quite a long time, because its plate resistance has already increased to 166% of its starting value (assumed that it was first according to the datasheet)
Furthermore, the Mu of the sample is 25% higher than the datasheet, but that is in the normal tolerance range.
So, I have now pos.Vg traces from a datasheet and neg.Vg traces from a measured sample with quite different mu and plate resistance - how to merge this two worlds ??
I decided to take the model gained from the data sheet, adjust the plate resistance manually by a adjustment factor in the LTspice graph window (and a similar way for mu adjustments) and then did the island effect fine-tuning. See attached graph.
You will find this LV13 LTspice model on my website:
http://adrianimmler.simplesite.com/440956786
How ever, if you are more interested in a spice model that is fitted to your measured curves, I can send you one in a PM (the pos Vg traces of this sample-based model will not be reliable, due to the lack of measured traces for pos Vg)
all the best, Adrian
Attachments
Hi rankot
The reason for the E1 is to adjust the both Mu factors, from my datasheet based model and from euro21's LV13 sample. That opens a way to determine the parameter kp (which describes the island effect at high negative Vg), because kp cannot be determined from the positive Vg datasheet traces.
The reason for the E1 is to adjust the both Mu factors, from my datasheet based model and from euro21's LV13 sample. That opens a way to determine the parameter kp (which describes the island effect at high negative Vg), because kp cannot be determined from the positive Vg datasheet traces.
Please put LV13 model here as text.
Hi euro21
Well I hesitate to do so, because my triode spice model is very large, around 80 lines of code. That would more or less fill up the whole forum page...
So I prefer to send you a private message with my code, ok?
all the best, Adrian
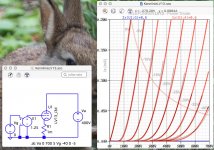
I've never seen that symbol in ltspice, so I was curious about it. How di you underlay datasheet graph under your spice graph window? Is it ltspice you're using, or some other software?
Yes I use LTspice. There are several possibilities to overlay data sheet traces. I use LayerX on my Mac, and Chaos Crystal on my windows laptop.
Hi euro21
Well I hesitate to do so, because my triode spice model is very large, around 80 lines of code. That would more or less fill up the whole forum page...
So I prefer to send you a private message with my code, ok?
all the best, Adrian
Thanks,
Regards
euro21
Hi all
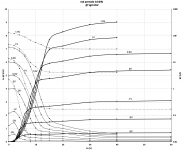
As the data sheet of the 1sh29b has a bit weak data in its diagram, here some measured curves from a sample of mine. I took the best of several tubes that is closest to the data sheet.
So, tube spice modeling may start on better data...
all the best, Adrian
As the data sheet of the 1sh29b has a bit weak data in its diagram, here some measured curves from a sample of mine. I took the best of several tubes that is closest to the data sheet.
So, tube spice modeling may start on better data...
all the best, Adrian
Attachments
6A6 and 6N7 are electrically equivalent as is soviet 6H7C (6N7S).
I have used this model:
I have used this model:
.SUBCKT 6N7S 1 2 3 ; P G C; (Triode) 20-Oct-2001
+ PARAMS: MU=35.29 EX=1.48 KG1=3201.6 KP=590.54
+ KVB=87.5 VCT=0.75 RGI=1000
+ CCG=4.3P CGP=2.4P CCP=5.4P
E1 7 0 VALUE=
+{V(1,3)/KP*LOG(1+EXP(KP*(1/MU+(V(2,3)+VCT)/SQRT(KVB+V(1,3)*V(1,3)))))}
RE1 7 0 1G
G1 1 3 VALUE={(PWR(V(7),EX)+PWRS(V(7),EX))/KG1}
RCP 1 3 1G ; TO AVOID FLOATING NODES IN MU-FOLLOWER
C1 2 3 {CCG} ; CATHODE-GRID;
C2 2 1 {CGP} ; GRID-PLATE;
C3 1 3 {CCP} ; CATHODE-PLATE;
D3 5 3 DX ; FOR GRID CURRENT
R1 2 5 {RGI} ; FOR GRID CURRENT
.MODEL DX D(IS=1N RS=1 CJO=10PF TT=1N)
- Home
- Amplifiers
- Tubes / Valves
- Vacuum Tube SPICE Models