About my last question - is it a question about drawing precision?... I don't see the wrapping phase actually touching the 180 deg. horizontal line... the 3:rd "wrap" (from left) in A2 seem to wrap at approx 150 deg?
It's basically a question of frequency resolution. You need to actually calculate the results at frequencies just before and just after a wrap to plot the curve at +/-180 degrees at each side.
Hi TNT,
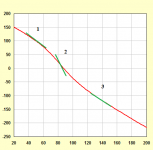
In effect, group delay at any given frequency can be represented by the tangent to the phase curve at that frequency (the tangent shows the gradient or slope at that point). A horizontal tangent line means zero group delay, a vertical tangent line (not achievable in practice) would mean infinite group delay.
Attachment 1 shows the tangent lines (in green) at frequencies of 50 Hz (1), 83 Hz (2) and 136 Hz (3).
The gradient of tangent 2 is greater than that of tangent 1, so the group delay at frequency 2 should be greater than that at frequency 1.
The gradient of tangent 3 is slightly less than that of tangent 1, so the group delay at frequency 3 should be less than that at frequency 1.
Sampling the group delay chart at 50 Hz, 83 Hz and 136 Hz shows this to be the case.
Group delay at frequency 1 (50 Hz) = 5.4364 msec
Group delay at frequency 2 (83 Hz) = 8.7623 msec
Group delay at frequency 3 (136 Hz) = 4.8942 msec
Standard wrapped phase is displayed by default. The Delay tool can be used to add a linear phase offset, or to remove an existing offset and restore standard wrapped phase. The default offset delay correction value is equivalent to the mean group delay across the -12 dB delimited SPL bandwidth.
You can safely disregard using the Delay tool if you wish") .
.
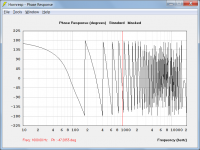
This is a "sampling rate" artefact. Hornresp uses 533 frequencies to generate the charts. In Attachment 2 the frequency just before the fourth wrap is 842.30 Hz. The next frequency used is 854.43 Hz. The difference between the two frequencies is 12.13 Hz. The wrap at -180 degrees actually occurs somewhere between 842.30 Hz and 854.43 Hz.
To determine the actual phase value at any frequency on a wrapped phase chart, count the number of wraps between the beginning of the chart and the frequency of interest, multiply that number by 360 and subtract the result from the wrapped frequency value.
For example, in Attachment 2 the actual unwrapped phase at 1000 Hz is -47.2855 - 4 * 360 = -1487.2855 degrees.
Kind regards,
David
Information in Attachment 2 and 3 (counting from left, starting on 1) makes perfect (eeh at least some
In effect, group delay at any given frequency can be represented by the tangent to the phase curve at that frequency (the tangent shows the gradient or slope at that point). A horizontal tangent line means zero group delay, a vertical tangent line (not achievable in practice) would mean infinite group delay.
Attachment 1 shows the tangent lines (in green) at frequencies of 50 Hz (1), 83 Hz (2) and 136 Hz (3).
The gradient of tangent 2 is greater than that of tangent 1, so the group delay at frequency 2 should be greater than that at frequency 1.
The gradient of tangent 3 is slightly less than that of tangent 1, so the group delay at frequency 3 should be less than that at frequency 1.
Sampling the group delay chart at 50 Hz, 83 Hz and 136 Hz shows this to be the case.
Group delay at frequency 1 (50 Hz) = 5.4364 msec
Group delay at frequency 2 (83 Hz) = 8.7623 msec
Group delay at frequency 3 (136 Hz) = 4.8942 msec
If A1 and A2 is indeed describing one and the same system, what is the difference between A1 and A2?
Standard wrapped phase is displayed by default. The Delay tool can be used to add a linear phase offset, or to remove an existing offset and restore standard wrapped phase. The default offset delay correction value is equivalent to the mean group delay across the -12 dB delimited SPL bandwidth.
You can safely disregard using the Delay tool if you wish
.I don't see the wrapping phase actually touching the 180 deg. horizontal line
This is a "sampling rate" artefact. Hornresp uses 533 frequencies to generate the charts. In Attachment 2 the frequency just before the fourth wrap is 842.30 Hz. The next frequency used is 854.43 Hz. The difference between the two frequencies is 12.13 Hz. The wrap at -180 degrees actually occurs somewhere between 842.30 Hz and 854.43 Hz.
To determine the actual phase value at any frequency on a wrapped phase chart, count the number of wraps between the beginning of the chart and the frequency of interest, multiply that number by 360 and subtract the result from the wrapped frequency value.
For example, in Attachment 2 the actual unwrapped phase at 1000 Hz is -47.2855 - 4 * 360 = -1487.2855 degrees.
Kind regards,
David
Attachments
BUG NOTICE
While preparing answers to the questions raised by TNT, I came across an anomaly in the Hornresp wrapped phase sample results. It only occurs at the wrapping points.
TEST EXAMPLE
Sampling the default record with resonances masked either side of the first wrap point, gives the following results:
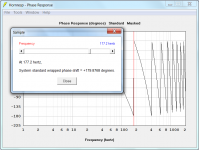
Wrapped phase at 174 Hz = -174.9511 degrees
Wrapped phase at 175 Hz = -130.3742 degrees
Wrapped phase at 176 Hz = +11.0871 degrees
Wrapped phase at 177 Hz = +152.5485 degrees
Wrapped phase at 178 Hz = +178.5906 degrees
The phase values either side of the first wrap point should be:
Wrapped phase at 174 Hz = -174.9528 degrees
Wrapped phase at 175 Hz = -176.5715 degrees
Wrapped phase at 176 Hz = -178.1875 degrees
Wrapped phase at 177 Hz = -179.8008 degrees
Wrapped phase at 178 Hz = +178.5886 degrees
This bug will be fixed in the next release.
While preparing answers to the questions raised by TNT, I came across an anomaly in the Hornresp wrapped phase sample results. It only occurs at the wrapping points.
TEST EXAMPLE
Sampling the default record with resonances masked either side of the first wrap point, gives the following results:
Wrapped phase at 174 Hz = -174.9511 degrees
Wrapped phase at 175 Hz = -130.3742 degrees
Wrapped phase at 176 Hz = +11.0871 degrees
Wrapped phase at 177 Hz = +152.5485 degrees
Wrapped phase at 178 Hz = +178.5906 degrees
The phase values either side of the first wrap point should be:
Wrapped phase at 174 Hz = -174.9528 degrees
Wrapped phase at 175 Hz = -176.5715 degrees
Wrapped phase at 176 Hz = -178.1875 degrees
Wrapped phase at 177 Hz = -179.8008 degrees
Wrapped phase at 178 Hz = +178.5886 degrees
This bug will be fixed in the next release.
Thank's for the clarification. I'm also glad to have been able to contribute
//
I'm guessing that you are probably an expert on this subject. So I have to ask.
Is it really true that TNT is Dynamite?

YouTube
I'm also glad to have been able to contribute
You did very well - thanks!
If not for your phase wrapping query, the bug might never have been identified
.The wrap at -180 degrees actually occurs somewhere between 842.30 Hz and 854.43 Hz.
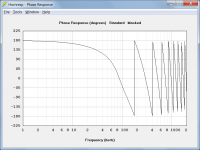
With the chart frequency range set to 1 - 2000 Hz and using the Sample tool (with the bug removed) the frequency at which the fourth wrap occurs can be narrowed down to between 852.4 Hz (where the phase is -179.9679 degrees) and 852.5 Hz (where the phase is +179.8728 degrees).
To me it would look very nice if the curve also touched the 180 line at 852,45 Hz
As shown in Attachment 2?
Attachments
Exactly. Nice! And accurate.
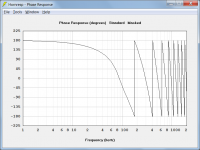
I agree that it would look neat, but unfortunately it is not possible to implement in a robust fashion for those systems having rapid phase reversals at higher frequencies. The existing chart is accurate - it is just that the number of frequencies used to generate the chart has to be finite. (There is at least one frequency point per screen pixel, to ensure that the maximum possible resolution is attained).
OK. So how to avoid question like this one in the future? This is a "measurement tool" where the observer might need some help with the interpretation as the result presented do indeed give an impression of precision but in reality there could be a problem to interpret what is displayed. Maybe if the curve was going from a solid line to a dashed one at the frequency where the frequency resolution is starting to give problems with presentation precision? At least that would be a reason to question what one sees. Well, I wont harass you anymore about this. Even if I havn't used the tool myself (yet) I undertand its widely used and appreciated. Congratulations for that and thanks for your answers!!
//
//
So how to avoid question like this one in the future?
Not sure that we can
.With the recently-identified bug removed, the Sample tool can show the phase value to within 1 Hz of the wrapping point (or to within 0.1 Hz when the 1 - 2000 Hz chart range is used). This should be close enough for anyone!
What is the phase value at the exact wrap frequency anyway?
.Attachments

Last edited:
Exactly. Nice! And accurate.
Hi TNT,
I think I may have managed to come up with a relatively robust method that will give us what we want
. If there are no "last-minute surprises" during testing (particularly with long horns where phase reversals can be quite close to each other) the refinement will be added in the next update.Kind regards,
David
If this were darts you would be hitting a triple 20. A little bit to the left I'm guessing ��
As you can see from my post above, hopefully we can end up doing even better
.What is the phase value at the exact wrap frequency anyway?
The wrapped phase value that is.
-180 degrees or +180 degrees?
It's a bit like quantum physics...
Schrödegree's catThe wrapped phase value that is.
-180 degrees or +180 degrees?
It's a bit like quantum physics...
.- Home
- Loudspeakers
- Subwoofers
- Hornresp