Where have I gone wrong?
Hi publius,
Change P = Eg ^ 2 / Ze ^ 2 * Re to P = Eg ^ 2 / Ze ^ 2 * Ret, where Ret is the real or resistive part of the complex impedance Ze.
Test example:
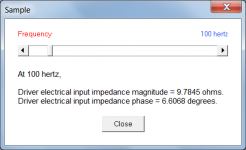
For the default record with resonances masked, at 100 Hz:
Eg = 2.83 volts
Ze = 9.7845 ohms
Ze phase = 6.6068 degrees
Ret = Ze * Cos(Ze phase) = 9.7195 ohms
P = Eg ^ 2 / Ze ^ 2 * Ret = 2.83 ^ 2 / 9.7845 ^ 2 * 9.7195 = 0.8131 watts
Kind regards,
David
Attachments
P = e^2 / Z * cos(theta); where cos(theta) = Re/Z
which reduces to e^2 / Z^2 * Re
Hi Publius,
This is a fair approximation for direct radiators, except near resonance. But for horns the motional impedance is much higher, so Re is no longer a valid approximation for the real part of the impedance.
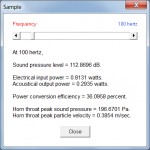
The change from total to net acoustical power is the reason why the old value of 1 acoustic watt is reduced to 0.61 acoustic watts in the example provided by 'publius'.
In case anyone was wondering, I used the terms "total" and "net" power simply to make it obvious that one quantity was greater than the other. The actual correct engineering terms to use are "apparent" and "real average" power
") .
.Because the acoustical radiation impedance is complex, with both resistive and reactive components, the acoustical output power is also complex.
W = P + j * Q
Where:
W = complex power
P = real power
Q = reactive power
Total or apparent power = magnitude of complex power = (P ^ 2 + Q ^ 2) ^ 0.5
Net or real average power = P
W = complex power
This is what the amplifier needs to supply
P = real power
This is what makes driver heat and generates power compresion, and so on.
Why not indicate both?
If you think about it I'd say that this is already the case in Hornresp. Eg is the amplifier input power or your P designation and the resulting simulation window Power gives you the results of the power in and all the complex power W results.
There is much happening under the hood!
Sometimes I think about how simple we believe something is. Try explaining how a light bulb works to someone that has never seen or used electricity.
Why not indicate both?
Hi LORDSANSUI,
Not sure what practical purpose that would really serve. Amplifier power ratings are normally expressed in terms of real or true power, not apparent power. I suspect that it would just confuse things even further
. (Note that my original comments referred to acoustical power, not electrical power).
Kind regards,
David
Last edited:
Eg is the amplifier input power
That's new! The last time I checked, Eg was the amplifier open-circuit rms output voltage
.Hi publius,
Change P = Eg ^ 2 / Ze ^ 2 * Re to P = Eg ^ 2 / Ze ^ 2 * Ret, where Ret is the real or resistive part of the complex impedance Ze.
Test example:
For the default record with resonances masked, at 100 Hz:
Eg = 2.83 volts
Ze = 9.7845 ohms
Ze phase = 6.6068 degrees
Ret = Ze * Cos(Ze phase) = 9.7195 ohms
P = Eg ^ 2 / Ze ^ 2 * Ret = 2.83 ^ 2 / 9.7845 ^ 2 * 9.7195 = 0.8131 watts
Kind regards,
David
Ah, thanks!!
I was under the impression that the real part of impedance was simply Re and that the contribution from reactance was the only difference between Re and Z. Now I see that isn't true.
That's new! The last time I checked, Eg was the amplifier open-circuit rms output voltage
Sure go ahead and make sense. Now I can't argue with you any more
Amplifier power ratings are normally expressed in terms of real or true power, not apparent power.
That is true because they simple measure it with a resistor. But when you plug and impedance (frequency dependent load) on it the power will be reduced. The power rating, at least, give us an idea about the maximum output voltage. But there is no much information about current capacity, it's strongly depedent to the output capacitors bench, slew rate, etc.
To plot power (real and/or aparent) it would be necessary to do it by each frequency. We can also identify the worst case looking at impedance curve. The lower values will be more critical when the audio signal is close to sinusoidal. In fact hornresp already have all these values saved somewere in the program's memory.
Considering that keep things simple is the way to go, probably there is no need to ad this at hornresp and it should stay with just acoustical power as you note and probably was my mistake
Is usual people compare loundspeakers deisgns in terms of output SPL, would be interesting to comparing them also in terms of electrical power demanding as well. Maybe the one that present +6dB SPL is the one that will present lower average impedance and will drain more current from the amplifier. Just thinking.
Is usual people compare loundspeakers deisgns in terms of output SPL, would be interesting to comparing them also in terms of electrical power demanding as well. Maybe the one that present +6dB SPL is the one that will present lower average impedance and will drain more current from the amplifier.
Hi LORDSANSUI,
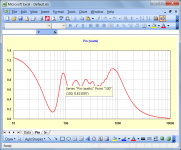
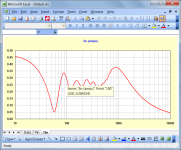
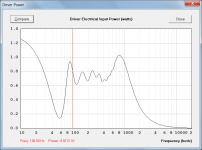
If you are interested in investigating these issues further, loudspeaker input power and current (Pin and Iin) values are included in the "All Chart Data" export file. Assuming zero-loss speaker cables, these values will also equal the amplifier output power and current.
Attached are Pin and Iin charts for the default record with resonances masked.
From the formula quoted earlier:
P = Eg ^ 2 / Ze ^ 2 * Ret = 2.83 ^ 2 / 9.7845 ^ 2 * 9.7195 = 0.8131 watts
We would expect P to have the same value as Pin, and Eg ^ 2 / Ze ^ 2 or (Eg / Ze) ^ 2 to have the same value as Iin ^ 2. As can be seen from the results below, this is indeed the case.
At 100 Hz:
P (formula) = 0.8131 watts
Pin (chart) = 0.8131 watts (rounded to 4 decimal places)
Eg / Ze (formula) = 2.83 / 9.7845 = 0.2892 amps
Iin (chart) = 0.2892 amps (rounded to 4 decimal places)
Note that the "Driver Electrical Input Power" chart also shows the amplifier output power, provided that the loudspeaker does not have multiple drivers, and zero-loss speaker leads are assumed.
Kind regards,
David
Attachments
Sure go ahead and make sense. Now I can't argue with you any more
Don't let that stop you
.Friend David ...
I think the translator did not help me much, but I'll try to simplify ...
My question would be how can I calculate a horn with serial duct in Hornresp.
Here in Brazil, some designers use their soft for this. But knowing his settings, I still do not understand how this is possible.
I even thought it might be in the Tools> Changer Type> Troat Adapter option, but I understand this as a one-time pass between the Vtc camera and the start of the horn segment (S1).
Friend David ...
I think the translator did not help me much, but I'll try to simplify ...
My question would be how can I calculate a horn with serial duct in Hornresp.
Here in Brazil, some designers use their soft for this. But knowing his settings, I still do not understand how this is possible.
I even thought it might be in the Tools> Changer Type> Troat Adapter option, but I understand this as a one-time pass between the Vtc camera and the start of the horn segment (S1).
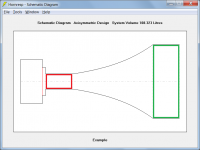
Hi M1 Audio,
I would normally interpret "a horn with serial duct" to mean a duct segment connected in series with a horn segment, either at the throat end or at the mouth end, as shown highlighted in red and green in the attached schematic diagram, but your throat adaptor comment makes me think that you may have something else in mind. Also, when you say "the Vtc camera", are you referring to the throat chamber perhaps?
As you can see, I am still a little confused
.Kind regards,
David
Attachments
So Mark ...
In terms of quantity, if I understood you correctly, this would already be the way I use it for several speakers.
My own doubt, it would be like inserting a series vent into the throat of the horn.
Yes it is the same method. Multiple speakers. The difficulty is that you must model the driver, the throat and the mouth correctly. You can probably do this in the compression chamber wizard.
There will be a difference in the acoustical impedance the driver sees in the simulation. It may be possible to use the multiple entry horn wizard. It will get you a little closer to the actual air loading on the cone and driver. I think you know that is the problem with simulating this correctly.
I have done work on bifurcated horns that really closely simulated the actual measurement. So for two simulated sections this can work quite well.
What I did for that was set up the horn dimensions as exactly one half the area of the intended horn from the throat on out to the mouth. Then I simulated them as two speakers in the multiple speaker wizard. To make this truly correct you should cut down the SPL output by 3 db when looking at the combined response.
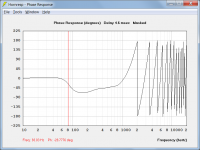
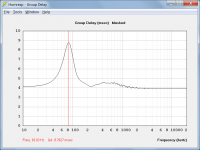
The GD is supposed to be the derivate of phase - right? In the picture, in the middle I drew and un-rolled version of the example case from above. Now, the GD is displayed as having a peak at 80 Hz but I cant see that there is something special happening with the phase around 80 Hz...
An other question about the phase chart - is it correct that the phase do not roll around but do take an extreme turn "back" before just reaching the -180 deg (at e.g. the red arrow)?
Most probably I'm incorrect in some or most of my assumptions...help me understand, please!
//
An other question about the phase chart - is it correct that the phase do not roll around but do take an extreme turn "back" before just reaching the -180 deg (at e.g. the red arrow)?
Most probably I'm incorrect in some or most of my assumptions...help me understand, please!
//
Attachments
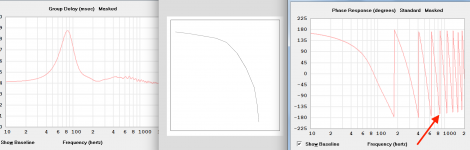
Hi TNT,
Group delay is the negative derivative of phase. It is a measure of the rate of change of phase with respect to frequency, and is positive when the phase slope is negative. The unit of group delay is time, usually expressed in milliseconds.
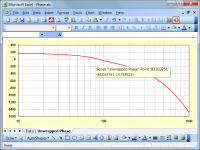
Notice how in Attachment 1 the phase curve goes from "curved" to "straight" at 83 hertz. The rate of change has increased at this frequency, resulting in a higher group delay. The increase in the rate of change is more apparent in Attachment 2, where a linear phase offset has been added. The inflection point in the phase curve at 83 hertz can be readily seen.
Hornresp calculates the group delay at f = 83.03 hertz as follows:
Phase at f - 0.1 hertz = Ph1 = 14.033976 degrees
Phase at f + 0.1 hertz = Ph2 = 13.403063 degrees
The frequency difference between the two phase points is (f + 0.1) - (f - 0.1) = 0.2 hertz
Group delay = -(Ph2 - Ph1) / 0.2
The units are degrees / hertz
1 hertz = 360 degrees / second
Therefore at 83.03 hertz:
Group delay = -(Ph2 - Ph1) / (0.2 * 360) * 1000 milliseconds
Group delay = -(13.403063 - 14.033976) / (0.2 * 360) * 1000 = 8.7627 milliseconds, as shown in Attachment 3.
Phase is normally shown wrapped at +/- 180 degrees, as in Attachment 1. The actual (unwrapped) phase up to 1000 hertz is shown in Attachment 4.
Kind regards,
David
The GD is supposed to be the derivate of phase - right?
Group delay is the negative derivative of phase. It is a measure of the rate of change of phase with respect to frequency, and is positive when the phase slope is negative. The unit of group delay is time, usually expressed in milliseconds.
I cant see that there is something special happening with the phase around 80 Hz...
Notice how in Attachment 1 the phase curve goes from "curved" to "straight" at 83 hertz. The rate of change has increased at this frequency, resulting in a higher group delay. The increase in the rate of change is more apparent in Attachment 2, where a linear phase offset has been added. The inflection point in the phase curve at 83 hertz can be readily seen.
Hornresp calculates the group delay at f = 83.03 hertz as follows:
Phase at f - 0.1 hertz = Ph1 = 14.033976 degrees
Phase at f + 0.1 hertz = Ph2 = 13.403063 degrees
The frequency difference between the two phase points is (f + 0.1) - (f - 0.1) = 0.2 hertz
Group delay = -(Ph2 - Ph1) / 0.2
The units are degrees / hertz
1 hertz = 360 degrees / second
Therefore at 83.03 hertz:
Group delay = -(Ph2 - Ph1) / (0.2 * 360) * 1000 milliseconds
Group delay = -(13.403063 - 14.033976) / (0.2 * 360) * 1000 = 8.7627 milliseconds, as shown in Attachment 3.
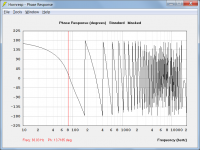
An other question about the phase chart - is it correct that the phase do not roll around but do take an extreme turn "back" before just reaching the -180 deg (at e.g. the red arrow)?
Phase is normally shown wrapped at +/- 180 degrees, as in Attachment 1. The actual (unwrapped) phase up to 1000 hertz is shown in Attachment 4.
Kind regards,
David
Attachments
Thanks!!
Information in Attachment 2 and 3 (counting from left, starting on 1) makes perfect (eeh at least some) sense to me.
A1 and A2 is not related, i.e. they don't come from the same system - right?
If A1 and A2 is indeed describing one and the same system, what is the difference between A1 and A2?
About my last question - is it a question about drawing precision?... I don't see the wrapping phase actually touching the 180 deg. horizontal line... the 3:rd "wrap" (from left) in A2 seem to wrap at approx 150 deg?
//
Information in Attachment 2 and 3 (counting from left, starting on 1) makes perfect (eeh at least some
) sense to me. A1 and A2 is not related, i.e. they don't come from the same system - right?
If A1 and A2 is indeed describing one and the same system, what is the difference between A1 and A2?
About my last question - is it a question about drawing precision?... I don't see the wrapping phase actually touching the 180 deg. horizontal line... the 3:rd "wrap" (from left) in A2 seem to wrap at approx 150 deg?
//
- Home
- Loudspeakers
- Subwoofers
- Hornresp