Torgeirs, look at the actual drivers in the array. Each of them will reflect off the floor on its way to the ear or microphone. This isn't one spot. It mimics the positions of the array as if it were mirrored in that floor making it twice as tall/long. So what you are suggesting is impossible to do. Just do a 2D drawing with the array and floor and choose a listening position. The reflections will seem to come from a mirror of the array itself.
As these are reflections and not actual drivers it won't be a perfect mirror. But each driver's unique floor reflection will be averaged out by all other drivers within the array. That's the directivity we see or experience.
Only parallel planes to the arrays have or create stronger common reflections. Even cabinet edges, if present, could be seen as a parallel plane. For sure side walls count and probably the close by TV.
Wesayso: As the elements close to the floor contribute much more to the reflection than the elements near the ceilling, the theory will not hold. ( I undertand the listening distance is comparable with the height of the array. So its near field and not far field)
Last edited:
Sure it will hold. They are still unique for each separate driver and not shared by the other drivers (in position) and as such the output is far less of an influence than you make it out to be.Wesayso: As the elements close to the floor contribute much more to the reflection than the elements near the ceilling, the theory will not hold. ( I undertand the listening distance is comparable with the height of the array. So its near field and not far field)
Hi Fluid,
Thanks for the detailed response.
- Guess I was wrong about the mic. Looks like it is omni. Thanks for clarifying that!
- Regarding the sub-100 Hz response, I do see significant variation. For example, if you look at your individual measurements between 30 and 40 Hz, and between 60 and 80 Hz, there are significant variations of up to 20 db. This is what I would expect. Maybe in the earlier measurements, the single measurement was close to the middle of the couch and the average just happened to be close to it. But you can see how correcting the average in this region will not be optimum for different positions.
- Regarding averaging, yes, it looks like it is helping isolate the speaker from the room, but isn't that what DRC does too with its FDW style filtering? Ultimately, the averaged measurement and correction will be less good in any one position because that position could be affected by a strong reflection, which was averaged out, but it will result in better sound everywhere relative to no correction. It's a trade-off and something everyone has to decide for themselves based on their listening habits and design criteria (for example, expected number of people listening to arrays simultaneously)
Thanks!
Guess we disagree. In my experience the 10 dB dip at 530 hz must be caused by a large plane between the speaker and listener. It seems to be at -10 dB so that should be a room boundary, mixing desk or table. Not diffraction or the TV. At least the TV influence should be cancelled by the elements over the TV and diffraction in speaker should be present in outdoor measurement
Just to be clear why I keep naging on first reflections. Reflections in the -10dB range with rollercoaster freqency content will degrade the sound.
The rollercoaster frequency content of the reflection can be caused by
*the of axis responce of the speaker or
*uneven reflexion index of the material that cause the reflexion
The rollercoaster frequency content of the reflection can be caused by
*the of axis responce of the speaker or
*uneven reflexion index of the material that cause the reflexion
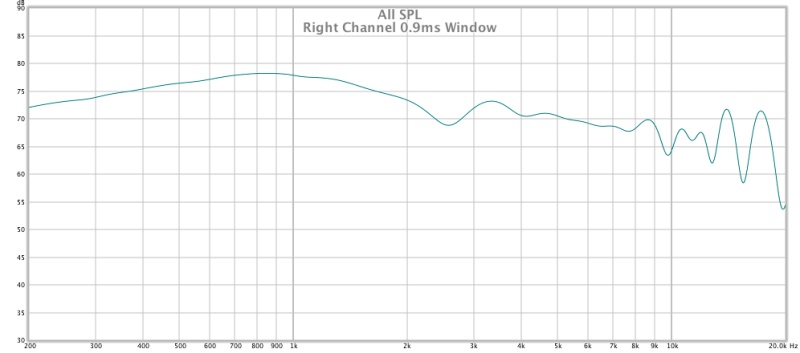
Windowing normal time response and looking at the freq resp. will give a clue of the HF spectre of the reflections. So the trick is to start the windowing just before the reflections (as if they where the main lobe in the time responce)
The length of the window gives the frequency resolution, 1/T where T is the length of the window.
I have added a window at 0.9ms just before the front wall reflection
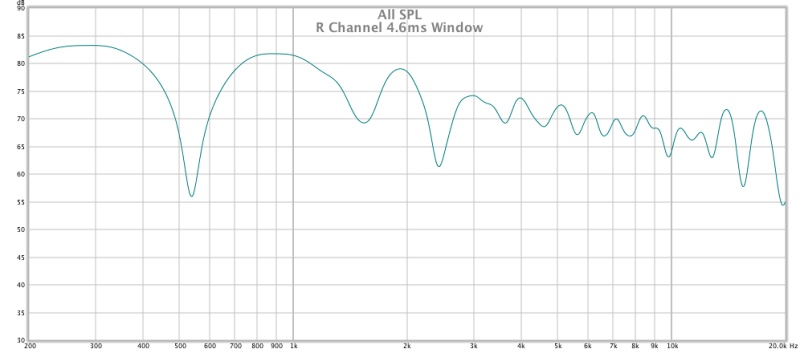
This is at 4.6ms just before the back wall reflection
Is this what you wanted to see?
Attachments


Fluid, Thanks for sharing.
Apparently the impulse response averaging is the more accurate method.
Two person, one using impulse average for FIR based EQ and another using average frequency response for IIR PEQ based EQ might come up with pretty different performance for the same apparent target curve, particularly below 300 as per your graphs.
Interesting. Guess who might be the sad one!
Happy to help where I can. Accurate is a relative term the methods show the data in different ways.
I would have to disagree with you below 300Hz as those graphs are actually much closer in agreement. Distances set the modal behaviour which dominates below the transition.
The main difference between the averaging methods is how dips and peaks are treated. The impulse averaging takes account of phase and weights the dips more heavily. The basic frequency average weights the peaks more. In either case it is actually beneficial to try "optical" averaging where you look at all the curves together on the screen and your eye will see the general trend quite well. You might well ignore a peak or a dip that is prominent in one of the mathematical averages.
The more variation there is in the measurements the less reliable the average is. If you have 3 measurements, +2, +2 and -4 you end up with zero as average. Not a good representation of any of the numbers.
In the graph above you can see that the frequency average has a peak at about 112Hz. That is because there is a peak there in most of the measurements, the impulse sees it differently.
Attachments

No problemHi Fluid,
Thanks for the detailed response.
- Guess I was wrong about the mic. Looks like it is omni. Thanks for clarifying that!
")
The main variations are at the prominent modal frequencies. It is hard to avoid those without a significant amount of bass trapping or helmholtz panels. Multisubs can do a similar thing, dipole woofers can work too in exciting less modes. I am not aware of anything else that will fit in the same spot as these arrays and work anywhere near as well without extra speakers, amps, treatments etc.- Regarding the sub-100 Hz response, I do see significant variation. For example, if you look at your individual measurements between 30 and 40 Hz, and between 60 and 80 Hz, there are significant variations of up to 20 db. This is what I would expect.
Yes the single measurement was in the Centre of the speakers at the listening position. The issues that appear to the left are in general the opposite to what happened to the right so they do tend to average out back to the middle!Maybe in the earlier measurements, the single measurement was close to the middle of the couch and the average just happened to be close to it. But you can see how correcting the average in this region will not be optimum for different positions.
- Regarding averaging, yes, it looks like it is helping isolate the speaker from the room, but isn't that what DRC does too with its FDW style filtering? Ultimately, the averaged measurement and correction will be less good in any one position because that position could be affected by a strong reflection, which was averaged out, but it will result in better sound everywhere relative to no correction. It's a trade-off and something everyone has to decide for themselves based on their listening habits and design criteria (for example, expected number of people listening to arrays simultaneously)
Thanks!
To me spatial averaging works better at reducing the room contribution while still maintaining higher resolution. FDW's work more to represent how we hear and reduce resolution in the measurement. I find they actually work quite well together rather than being an either or choice.
Obviously you can get a more specific correction if you are shooting for only one point in space. Some of the negatives attributed to room correction are partly based on this. Move an inch and it's not valid. What my results show is that I could use a single position measurement and it is pretty close to the average in frequency response when smoothed. The time response is a different story though and because I will be doing time correction I want that to be a little cleaner. If I had a lot of treatment it probably wouldn't matter.
You don't hear what is in the middle of your head you hear two things separated by your ears processed by your brain to make sense of it. If you are aiming for a single seat correction I think the best way is to do an average of both ear positions rather than one point in the middle. This graph shows the difference between an average of 10cm to the left of centre and 10cm to the right vs a single position between the two. The main differences are in the 1.5 to 5K region so they will impact perception and be quite audible.
The impulse averaged measurement includes all the strong reflections the ones from the main boundaries. What is averaged out is what is different between the positions the tiny differences that only matter at that point in space. I think you seem to be missing that point and it might explain why you can't see a benefit from the impulse averaging procedure.
Attachments

Thank you for sharing. I'll try to process all of this.
I didn't mean the graphs are different below 300Hz. They are very close. However, above 300Hz, they are different. So, a target curves based on the two different averaging methods will have different performance above or below 300Hz depending how you see it.
I would have to disagree with you below 300Hz as those graphs are actually much closer in agreement. Distances set the modal behaviour which dominates below the transition.
I didn't mean the graphs are different below 300Hz. They are very close. However, above 300Hz, they are different. So, a target curves based on the two different averaging methods will have different performance above or below 300Hz depending how you see it.
Guess we disagree. In my experience the 10 dB dip at 530 hz must be caused by a large plane between the speaker and listener. It seems to be at -10 dB so that should be a room boundary, mixing desk or table. Not diffraction or the TV. At least the TV influence should be cancelled by the elements over the TV and diffraction in speaker should be present in outdoor measurement
I imagine your experience is with more traditional cone dome type designs, let me know if I am wrong but I don't think you have any experience with a floor to ceiling line array. I think the rest might be clearer when I show the graphs below. They are the best I can come up with to demonstrate it, beyond that if you still disagree then we will need to leave it be
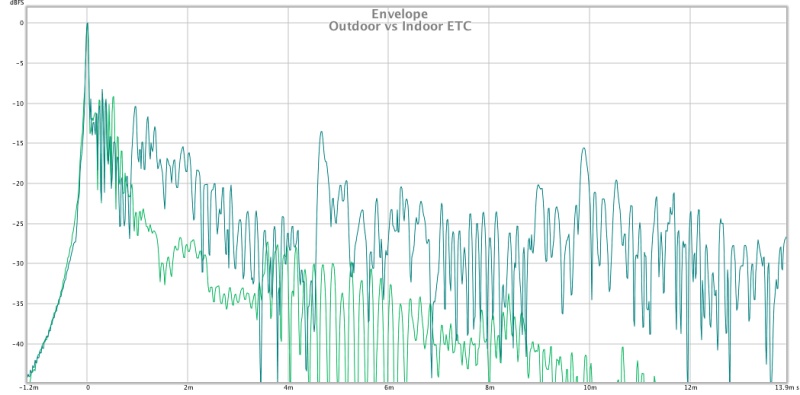
An 20 ms ETC of outdoor measurement could give an indication how fast the energy falls with no room.
Here is ETC of the outdoor and indoor single Centre measurement. What I see in this is that the very early stuff is the chatter that occurs because there are 25 separate drivers with time of arrival differences. Then I see a reflection at about 0.96ms. This corresponds with the front wall distance. Then I see another at 4.66ms this corresponds with the rear wall distance. I do not see a floor reflection. If I was to treat the front and rear walls I could probably get rid of most of the early reflections acoustically.
Now here is the outdoor vs vector averaged ETC. This one is for RA7 to show that the same reflections are still there they are just at a lower level and the general chatter has reduced quite considerably.
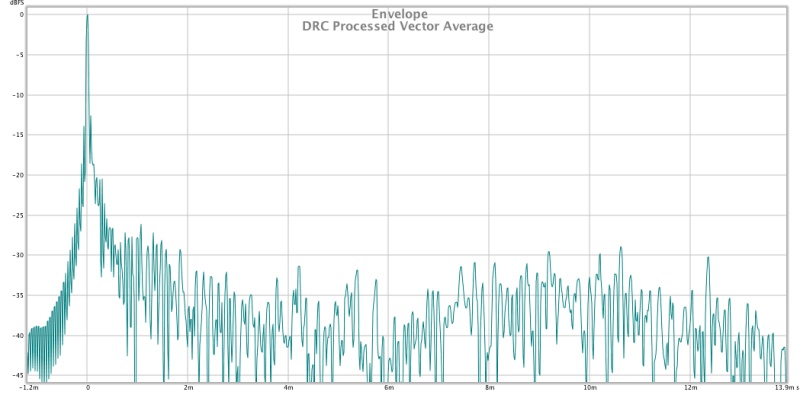
And then here is the reason why DRC is going to be used to help fix some of these time related issues. Where did all the reflections go
Attachments


Thank you for sharing. I'll try to process all of this.
I didn't mean the graphs are different below 300Hz. They are very close. However, above 300Hz, they are different. So, a target curves based on the two different averaging methods will have different performance above or below 300Hz depending how you see it.
No problem happy to help if I can. I think the graph in #678 show what I am talking about quite well. In all the graphs there is a hinge at the transition frequency where the overall trend of the line swings from.
The impulse average leaves all the dips in which are real and mainly caused by reflections so they need to be treated carefully and not just filled in with EQ.
The level steadily declines as more of the overall reverberation effects have been averaged out. When a correction based on the average is played back in the same room the reverberation will be added back bringing the overall level back up.
The basic frequency average ignores all the dips because there are corresponding peaks in other positions so they end up at zero which isn't really correct anywhere. The level is higher because the reverberation effects are still there and do add together because they are quite dense.
Where and how to draw a target curve has a lot to do with taste, but you can see how the general trend for the reverb is to add more and more to the level as you go beyond the transition so it makes sense to have a target curve that is somewhat the opposite of that to end up with a flatter perceived response.
I have added a window at 0.9ms just before the front wall reflection
This is at 4.6ms just before the back wall reflection
Is this what you wanted to see?
Ok, so its the back wall that is the main offender. But is it the only one?
Can't rule out the floor from the ETC as the reflections are as high as they are between 1 and 3 ms.
Actually I meant starting the window at the points you have stopped them.
But this is also interesting.
I am supprised the dip is that big, caused by front wall reflection.
I imagine your experience is with more traditional cone dome type designs, let me know if I am wrong but I don't think you have any experience with a floor to ceiling line array. I think the rest might be clearer when I show the graphs below. They are the best I can come up with to demonstrate it, beyond that if you still disagree then we will need to leave it be
Here is ETC of the outdoor and indoor single Centre measurement. What I see in this is that the very early stuff is the chatter that occurs because there are 25 separate drivers with time of arrival differences. Then I see a reflection at about 0.96ms. This corresponds with the front wall distance. Then I see another at 4.66ms this corresponds with the rear wall distance. I do not see a floor reflection. If I was to treat the front and rear walls I could probably get rid of most of the early reflections acoustically.
Now here is the outdoor vs vector averaged ETC. This one is for RA7 to show that the same reflections are still there they are just at a lower level and the general chatter has reduced quite considerably.
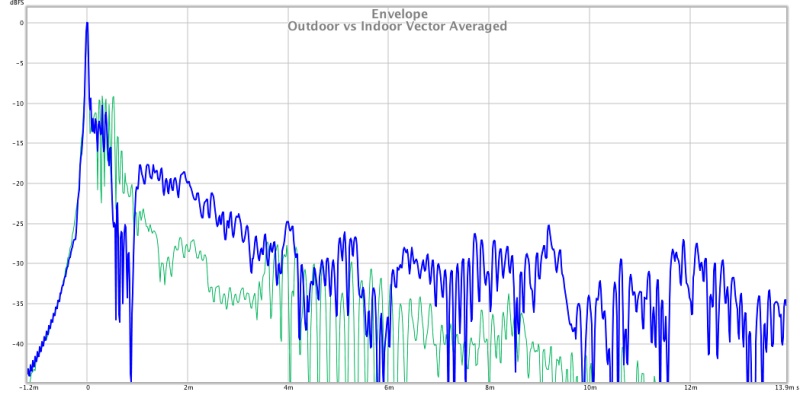
And then here is the reason why DRC is going to be used to help fix some of these time related issues. Where did all the reflections go
They are gone in that exact position. Move the mic and they are back twofold,
Guess neither of us has experience with floor to ceiling arrays as there are clearly some room under and over the array.
Anyways really interresting measurements
They are gone in that exact position. Move the mic and they are back twofold,
Guess neither of us has experience with floor to ceiling arrays as there are clearly some room under and over the array.
Anyways really interresting measurements
I find those comments a bit disingenuous after I put a fair bit of effort into posting what I consider to be relevant data to try and explain my point of view.
I had REW open to to take screenshots of the windows moved in time as you asked but I won't be posting them.
I have tried to post information that might help others understand what these speakers are doing in case they are interested in building something similar, I can now see why other people have politely avoided measurement requests.
Torgeirs, a hint, you're not looking for a single floor reflection in the ETC. You're looking for 25 of them . And to make things worse, they are destined to look like the output from an array of 50 drivers.
The ceiling reflections would be a similar story, though they might be easier to find due to the gap between the array and the ceiling.
They won't look anything like the usual speakers show you and will be down by 25 dB Or more. Good hunting! :-D
. And to make things worse, they are destined to look like the output from an array of 50 drivers.The ceiling reflections would be a similar story, though they might be easier to find due to the gap between the array and the ceiling.
They won't look anything like the usual speakers show you and will be down by 25 dB Or more. Good hunting! :-D
.....And then here is the reason why DRC is going to be used to help fix some of these time related issues. Where did all the reflections go
Result looks great
and you probably worked very hard lately and gently shared more than most thanks for that, can i say even on request don't share your bank account/ID numbers here .Based yourself being a drummer does setup subjective perform well into this area.
I find those comments a bit disingenuous after I put a fair bit of effort into posting what I consider to be relevant data to try and explain my point of view.
I had REW open to to take screenshots of the windows moved in time as you asked but I won't be posting them.
I have tried to post information that might help others understand what these speakers are doing in case they are interested in building something similar, I can now see why other people have politely avoided measurement requests.
Sorry about the rather harsh comment. But I really think the boundary conditions has importance for arrays also.
Even if the postings are wasted on me, other thanmyself learning a lot, they will be a very good reference for others that are interested in building similar system.
I downloaded the JBL line array program,CBT and made simulations with the 200LA that most closely resembles your array.
See the SPL at floor reflection is down about -6dB so that's quite a nice attunation.
I also had an explanation for the extreem back wall reflection mid speaker.
As you can see the SPL is the same 20 cm behind the speaker as 20 cm in front of the speaker at 500 Hz.
Attachments

- Home
- Loudspeakers
- Full Range
- Full Range TC9 Line Array CNC Cabinet