Should I assume that all of the quotes are for 1kHz?
20Hz can be quite difficult due to usually less agc filtering effectiveness on reducing agc ripple at low frequencies. This is where the rubber really meets the road for many oscillators, especially those of rather conventional design.
Are there any quotes of 20Hz THD here, and do any of them include some quote of amplitude settling time? Some HP oscillators had a switch for low distortion, but under that condition settling time to, say, 0.1dB was quite long.
Similarly 20kHz THD is more difficult to get way down than 1kHz THD. Are there any quotes here of 20kHz THD, especially if made in greater than 100kHz residual measurement bandwidth?
As far as my preliminary results are reliable, distortion for my design appears to be very low (< -130 dB) from 10 Hz to 20 kHz. Settling time for a 100 Hz to 10 Hz range change was measured as 3.5 s, but should be better in the final design.
Is the injection lock isolated? My biggest problem was the hum and noise coming from a common ground. Even transformer isolation still let some through.
The common-mode input impedance is about 50 kOhm. Not perfect isolation, but at least a substantial amount.
I requested these 5V reed relays as samples about 5 years ago, so I need to reestablish contact with the company.
They are a common form factor - with the price about US0.30 to US$0.40 each.
Thanks for checking. When placing my order last week I realize that I had all reed relays in stock already, so I don't have any need at the moment.
Thermal distortion introduced by bulk foil resistors is fairly easy to understand in an application like the feedback resistor in a power amplifier, but more difficult to see in a line-level application like an oscillator, where dissipation due to the signal is very small.
Particularly in the output attenuator, but also in the feedback network of the output driver, the power dissipation is quite substantial. That's because the resistance needs to be low to minimize noise and output impedance.
The Vishay design will have a sensitivity to certain transient changes. It's actually a strain gauge with a substrate matched to the resistors thermal expansion to counter the thermal coefficient. Typical of any balancing act like this there are circumstances where the substrate can't track at perfect speed.
True. The issue has been recognized by Vishay years ago--see US-patent 4677413. Unfortunately they haven't found a suitable substrate yet to implement the suggested countermeasure in a commercial resistor.
Just to make sure: Bulk metal resistors have lower distortion than ordinary thin film parts (e.g. MiniMELF with 50 ppm tempco). It's just that the distortion reduction is much less than the price increase, so I found it to be cheaper to just use more standard resistors.
Samuel
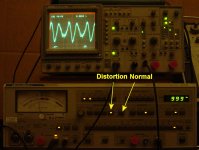
Before presenting the measurements it is important to understand how the Shibasoku AD725D analyzer operates.
In Normal mode the analyzer operates as any other audio analyzer. The 725D ranges down to 0.0003%, -110 dBV FS of the meter. And when the meter is at full scale the monitor output is 1Vrms, 0dBV.
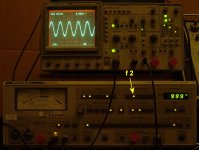
In Analysis mode the output of the 'Normal mode' is sampled synchronously to the input frequency. Unlike audio sampling the sampling frequency is variable with the input signal frequency. This divides the signal into phases equal to the sample rate. If I remember correctly each cycle is sampled 64 time per cycle in the low to mid frequency range. The sample rate generator is phase locked to the input signal. The samples are put through a discrete DSP where synchronous averaging is performed. Anything random like noise divided down and any constant signal is averages the same. So the noise is removed but not the signal.The processed signal is passed to a DAC and reconstructed at a fixed frequency of 488.281Hz a binary division of the 1MHz system clock. The output of the DAC is always 488.281Hz regardless of input signal frequency. This approach allows fixed tuned filters to be used on the reconstructed signal.
The Shibasoku AD725D analyses the first 10 harmonics and this is used to determine THD.
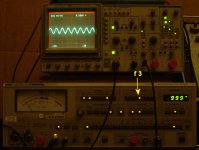
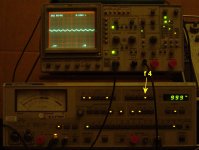
In addition the first five harmonic can be viewed individually by the push of a button and a single harmonic can be seen on the Analysis monitor output.
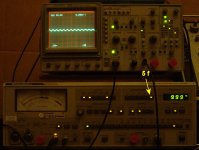
For anyone following along who doesn't have a Shibasoku 725,
I included some pics that might help explain what David is describing.
For these pics an HP339A was set to 1V output and input into the Shibasoku 725D, Then the Cal Check, (Input) Level, and Relative Adjust were adjusted the same meter reading (Normalized, for
lack of a better word).
Approx 1kHz, 1V Input.
Attachments
Last edited:
David or Someone,
I would appreciate some explanation about some of the images.
I don't understand them intuitively, or by just viewing them so I'm
not sure how to intemperate what I view and how to correlate that
with David's measurements.
For example in PI[C]2 [lack of wee], the first plot has a lot of
versicle lines in it. Thinking these might be distortion harmonics.
Trying to figure out what the fundimental is and at what level,
and how to adjust what I see with what David wrote.
Here is the link to it so it won't be on another page:
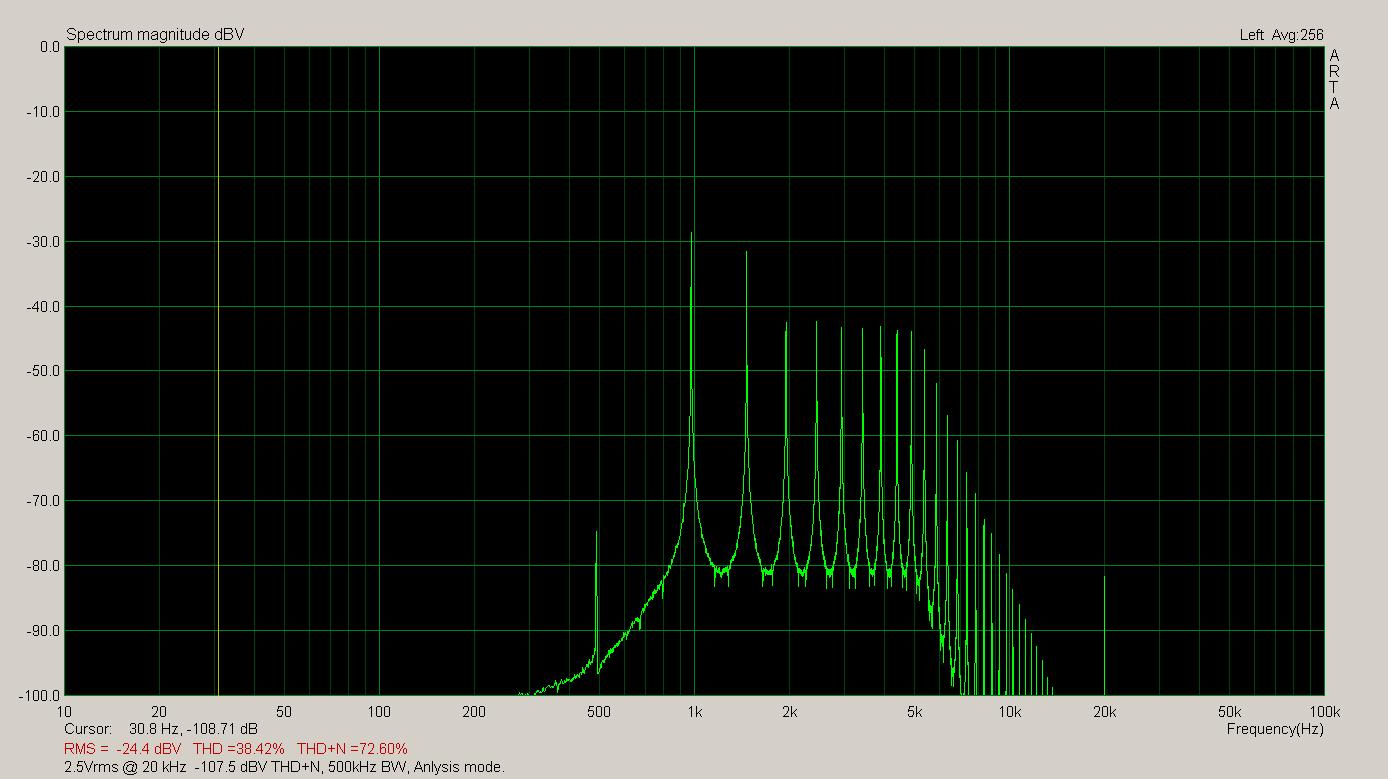
So this is at 20kHz and is at -107 dBV THD+N, but what I don't
understand are the products before it, such at -29dB & -32dB?
at 1kHz and after that?
Is that a sweep through those frequencies?
The Oracle of Sync informs me that ARTA is in my future.
Not sure what good sound cards are available for a DELL
lap top with USB and an HDMI port. I think it had a mem
card port or something like it along the right side just
in front of the USB port and the DVD drive.
Richard if you recall what was the software that you mentioned
a year or more ago that could capture as many windows as
one wanted and put them all together in one if need be?
It was quite expensive and I think it had a $500 annual
fee to use it....or something like that.
Cheers,
Sync
I would appreciate some explanation about some of the images.
I don't understand them intuitively, or by just viewing them so I'm
not sure how to intemperate what I view and how to correlate that
with David's measurements.
For example in PI[C]2 [lack of wee], the first plot has a lot of
versicle lines in it. Thinking these might be distortion harmonics.
Trying to figure out what the fundimental is and at what level,
and how to adjust what I see with what David wrote.
Here is the link to it so it won't be on another page:
So this is at 20kHz and is at -107 dBV THD+N, but what I don't
understand are the products before it, such at -29dB & -32dB?
at 1kHz and after that?
Is that a sweep through those frequencies?
The Oracle of Sync informs me that ARTA is in my future.
Not sure what good sound cards are available for a DELL
lap top with USB and an HDMI port. I think it had a mem
card port or something like it along the right side just
in front of the USB port and the DVD drive.
Richard if you recall what was the software that you mentioned
a year or more ago that could capture as many windows as
one wanted and put them all together in one if need be?
It was quite expensive and I think it had a $500 annual
fee to use it....or something like that.
Cheers,
Sync
Last edited:
Bob you asked this question before in this thread and it's never been properly answered.
Here are measurement with a Shibasoku AD725D and my oscillator dlbSVO. The dlb are my initials and State Variable Oscillator.
Before presenting the measurements it is important to understand how the Shibasoku AD725D analyzer operates.
In Normal mode the analyzer operates as any other audio analyzer. The 725D ranges down to 0.0003%, -110 dBV FS of the meter. And when the meter is at full scale the monitor output is 1Vrms, 0dBV.
In Analysis mode the output of the 'Normal mode' is sampled synchronously to the input frequency. Unlike audio sampling the sampling frequency is variable with the input signal frequency. This divides the signal into phases equal to the sample rate. If I remember correctly each cycle is sampled 64 time per cycle in the low to mid frequency range. The sample rate generator is phase locked to the input signal. The samples are put through a discrete DSP where synchronous averaging is performed. Anything random like noise divided down and any constant signal is averages the same. So the noise is removed but not the signal.The processed signal is passed to a DAC and reconstructed at a fixed frequency of 488.281Hz a binary division of the 1MHz system clock. The output of the DAC is always 488.281Hz regardless of input signal frequency. This approach allows fixed tuned filters to be used on the reconstructed signal.
The Shibasoku AD725D analyses the first 10 harmonics and this is used to determine THD.
In addition the first five harmonic can be viewed individually by the push of a button and a single harmonic can be seen on the Analysis monitor output.
During these measurement I will be switching between the Normal monitor port and the analysis monitor port depending on the measurement taken. To keep things simple the range is fixed at 0.001% (-100dBV). I have an EMU0204 connected to the monitor output.
This and ARTA are calibrated for 1Vrms (0dBV) FS. Therefore FS on ARTA correspond to -100dBV. ARTA is to be read directly - 100dBV.
The measurement are as follows:
Shibasoku AD725D & dlbSVO
2.5Vrms @ 20Hz BW = 30.0 kHz -134.2 dBV THD-10, -120.9 dBV THD+N
2.5Vrms @ 1kHz BW = 29.6 kHz -138.4 dBV THD-10, -118.8 dBV THD+N
2.5Vrms @ 2kHz BW = 29.6 kHz -138.4 dBV THD-10, -117.7 dBV THD+N
2.5Vrms @ 10kHz BW = 99.6 kHz -127.0 dBV THD-10, -113.2 dBV THD+N
2.5Vrms @ 16kHz BW = 99.6 kHz -125.2 dBV THD-10, -109.9 dBV THD+N
2.5Vrms @ 20kHz BW = 500.0 kHz -123.1 dBV THD-10, -107.5 dBV THD+N
2.5Vrms @ 89kHz BW = 500.0 kHz - 99.0 dBV THD-10, - 97.6 dBV THD+N
Cheers,
Thanks David for your detailed explanation of the workings of the analyzer and these very helpful measurements. It is especially cool how they synchronously average out the noise to essentially isolate THD from THD+N.
The first number I always look at is THD20 and THD+N 20. At THD20 about 3dB below 0.0001%, the performance is truly impressive. Also, at THD20+N in a full 500kHz bandwidth being about 0.0004% is also very impressive.
For comparison, my DIY THD analyzer does 0.0006% THD+N at 20kHz in a 200kHz bandwidth, but I very much doubt that its THD alone is nearly as good (but I've never been able to measure its THD alone at that frequency).
At 1kHz, with THD being about 20dB below the noise is sterling!
Finally, THD and THD+N at 20Hz being just about as good as at 1kHz also is surprizingly good - at least to me, as I always worry about noise and distortion contributions from the oscillator and analyzer control loops at low frequencies.
Wish I had one!
Cheers,
Bob
Particularly in the output attenuator, but also in the feedback network of the output driver, the power dissipation is quite substantial. That's because the resistance needs to be low to minimize noise and output impedance.
Samuel
In an AES presentation early this year by Doug Self about the distortion due to heating in feedback resistors, Bruce Hofer of AP commented that in a feedback chain of, say, 20k to 1k, you should build the 20k from 20 times 1 k resistors identical to the other 1k, and you'd be done with the thermal distortion.
I tend to take anything Bruce says quite seriously (though not as gospel ;-).
Jan
In an AES presentation early this year by Doug Self about the distortion due to heating in feedback resistors, Bruce Hofer of AP commented that in a feedback chain of, say, 20k to 1k, you should build the 20k from 20 times 1 k resistors identical to the other 1k, and you'd be done with the thermal distortion.
Yes, because the power coefficient of one feedback arm cancels that of the other (gain is only the ratio of the two arms, and if both change the same, no distortion occurs).
The cancellation effect is limited by the tempco matching of the resistors. According to my resistor distortion measurements, I'd expect a typical distortion reduction of ~10 dB, perhaps 20 dB if the tempco shows a rather tight distribution.
In a gain stage/attenuator with non-integer or variable gain/attenuation, the technique can only be partially applied.
Samuel
Thanks David for your detailed explanation of the workings of the analyzer and these very helpful measurements. It is especially cool how they synchronously average out the noise to essentially isolate THD from THD+N.
The first number I always look at is THD20 and THD+N 20. At THD20 about 3dB below 0.0001%, the performance is truly impressive. Also, at THD20+N in a full 500kHz bandwidth being about 0.0004% is also very impressive.
For comparison, my DIY THD analyzer does 0.0006% THD+N at 20kHz in a 200kHz bandwidth, but I very much doubt that its THD alone is nearly as good (but I've never been able to measure its THD alone at that frequency).
At 1kHz, with THD being about 20dB below the noise is sterling!
Finally, THD and THD+N at 20Hz being just about as good as at 1kHz also is surprizingly good - at least to me, as I always worry about noise and distortion contributions from the oscillator and analyzer control loops at low frequencies.
Wish I had one!
Cheers,
Bob
There is one on Ebay right now for $999.00. I'm sure you can talk the guy down.
I got mine for $900.00USD.
In spite of how good the 725 is it is still plagued with noise.
Most of those measurement shown are the noise residual of the 725D.
The 725D has memory of it's settings. One can turn the analyzer off and when it powers up
it returns to the last settings. The sampling can be locked by pressing a hold button.
This make it possible to examine effect of intrinsic noise coming from various stages by removing a select card. You can see where the meter settles. Most of the noise is off the BEF (Band Eliminate Filter), notch filters, there is three of them . Not much can be done here as it's mostly passive noise. Resistors in the mega ohms etc.
How's the noise in your analyzer?
David or Someone,
I would appreciate some explanation about some of the images.
I don't understand them intuitively, or by just viewing them so I'm
not sure how to intemperate what I view and how to correlate that
with David's measurements.
For example in PI[C]2 [lack of wee], the first plot has a lot of
versicle lines in it. Thinking these might be distortion harmonics.
Trying to figure out what the fundimental is and at what level,
and how to adjust what I see with what David wrote.
Here is the link to it so it won't be on another page:
So this is at 20kHz and is at -107 dBV THD+N, but what I don't
understand are the products before it, such at -29dB & -32dB?
at 1kHz and after that?
Is that a sweep through those frequencies?
The Oracle of Sync informs me that ARTA is in my future.
Not sure what good sound cards are available for a DELL
lap top with USB and an HDMI port. I think it had a mem
card port or something like it along the right side just
in front of the USB port and the DVD drive.
Richard if you recall what was the software that you mentioned
a year or more ago that could capture as many windows as
one wanted and put them all together in one if need be?
It was quite expensive and I think it had a $500 annual
fee to use it....or something like that.
Cheers,
Sync
Sync any sampled data can be reconstructed at a different frequency from the frequency it was originally sampled with. This hold true for fixed rate sampling as well as synchronous sampling. if you took audio samples and and played them back at half the recorded sample rate the pitch of the music would be half and the song would play for twice as long.
It's just like running an audio recording on tape at half the speed.
In communications, Am radio for example, it is desirable to to convert, replace all incoming carriers by filtering them off and replacing them with a local oscillator fixed to one frequency called IF. This simplifies the demodulation filters. One set for all frequencies.
So what Shibasoku did here was not a new concept at the time.
The reconstruction sample rate is about 488Hz. What you see near 1kHz is the second H. On the left of that is the suppressed fundamental. On the right is the 3rd H and so forth upwards 4th H etc. it takes a bit of getting used to but all sampled frequencies are played back the same, at the same frequency. This is very useful for us because we can use a spectrum analyzer or FFT on the Analysis output port and never worry about having enough bandwidth in terms of maximum sample rate of our sound card. Everything is well within the audio bandwidth and at a level we don't need question the accuracy.
Yes, because the power coefficient of one feedback arm cancels that of the other (gain is only the ratio of the two arms, and if both change the same, no distortion occurs).
The cancellation effect is limited by the tempco matching of the resistors. According to my resistor distortion measurements, I'd expect a typical distortion reduction of ~10 dB, perhaps 20 dB if the tempco shows a rather tight distribution.
In a gain stage/attenuator with non-integer or variable gain/attenuation, the technique can only be partially applied.
Samuel
Thanks Samuel. So here is the question that I have. How bad do we think this is in line-level circuits like attenuators, where we might have 1V across a 1/4 watt metal film 1k resistor for a milliwatt of signal dissipation? Let's assume a resistor with 25ppm TC and 20Hz.
I saw this thermal distortion in my MOSFET power amplifier at 20Hz. So I put in a 2W metal film feedback shunt resistor and two 2W metal film resistors in series in the feedback path. The thermal distortion vanished. The feedback resistor was about 4k and the max signal level across it was about 20V rms. Signal dissipation was thus about 5mA * 20V = 100mW for effectively a 4-watt resistor. This arrangement killed the thermal distortion and probably drove the resistor contribution down to the 0.0001% range, since the analyzer was capable of doing better than 0,001% residual at 20Hz.
In fairness, there was probably some thermal distortion cancellation due to the 1W shunt resistor. That resistor, at about 200 ohms, had 1V across it, so its signal dissipation was on the order of 5mW, negligible in comparison to the FB resistor, so not much distortion cancellation was likely.
So, waiving hands mightily, if 100mW for a 4-watt resistor drops thermal distortion to 0.0001%, then scaling would seem to suggest that 1mW for a 0.04W resistor would achieve the same low distortion. That would seem to suggest that a 1/4W metal film 1k with 1mW signal dissipation would be much better than 0.0001%.
Does this anecdotal hand-waiving make any sense?
Cheers,
Bob
I can see gain stabilization from matching the tempco of the divider (long been done in precision AC calibrators) but a waveform interaction will not necessarily cancel. It could get multiplied. The whole thing gives me a "brain cramp".
Except for the first BEF the noise contribution of the BEF's should be well below the input noise. I'll go back and sketch out the gain structure to see if I overlooked something.
Except for the first BEF the noise contribution of the BEF's should be well below the input noise. I'll go back and sketch out the gain structure to see if I overlooked something.
In spite of how good the 725 is it is still plagued with noise.
Most of those measurement shown are the noise residual of the 725D.
The 725D has memory of it's settings. One can turn the analyzer off and when it powers up
it returns to the last settings. The sampling can be locked by pressing a hold button.
This make it possible to examine effect of intrinsic noise coming from various stages by removing a select card. You can see where the meter settles. Most of the noise is off the BEF (Band Eliminate Filter), notch filters, there is three of them . Not much can be done here as it's mostly passive noise. Resistors in the mega ohms etc.
How's the noise in your analyzer?
Hi David,
My loop back THD+N at 20kHz residual reads 0.0006% with a residual noise bandwidth of 200kHz. The residual waveform has an identifiable shape, but is very noisy. If I had to guess, I'd say the THD and noise are each on the order of 0.0004%, which I think would suggest that the noise is on the order of -108dB.
Cheers,
Bob
Thanks David, good example, even I could understand that.")
Well it not a good description of superheterodyne but you got, That's what counts.
I can see gain stabilization from matching the tempco of the divider (long been done in precision AC calibrators) but a waveform interaction will not necessarily cancel. It could get multiplied. The whole thing gives me a "brain cramp".
Except for the first BEF the noise contribution of the BEF's should be well below the input noise. I'll go back and sketch out the gain structure to see if I overlooked something.
With the Twin T in the 725D removed which breaks the signal chain there is quite a bit of noise. It drives the meter to 11% of the 0.001% range. With the A4, BEF 2 & 3, board removed the noise drops to 1% on the meter.
The noise is the difference between THD+N and THD. I think this is the 725D residual but some of might be from the oscillator.
if you pull the board you need to make the source Z for the next stage look like the output Z of the previous stage. The bipolar opamps will get really noisy if the input Z becomes high.
The following is for the 725B (the schematic we all have).
The input amp (impedance converter) has variable gain which makes finding the optimum input level harder. I seem to remember the best is a little below 3V in. The input amp scales from 6 to 26 dB. At the lowest gain with an input noise around 4-5 nV/rtHz the next stage needs to be no more than around 6-7 nV/rtHz. The 2nd BEF has a 20 dB gain it seems and a 36K resistor to ground and 1K in series. The 1K will limit it to no better than around 4 nV/rtHz but the 36K will be significant noise.
The interesting comparison would be noise vs. sum of distortion products. The noise will be roughly proportional to the bandwidth. The 1/F noise may be dominant but the 400 Hz filter makes that easy to check for. If the input is 3V and the noise is 4 nV/rtHz then in a 30 KHz band the noise will be -123 dBV or -133 dBC (3V for C). In other words the limit on paper for a 725 will be about -133 dB THD+N. With an 80 KHz band -128 dB THD+N. 500KHz will get -120 dB THD+N. However the harmonics and noise in the source will limit these numbers.
With 6 dB of gain at the input stage and 20 at the second BEF as long as the first BEF isn't really noisy the system should be limited by the first stage (and the input attenuator, a more intractable problem). However replacing the 7W input resistor on the A1 board with a 3W 120V light bulb will lower the input noise floor on the 3V and lower ranges without giving up any protection.
How bad do we think this is in line-level circuits like attenuators, where we might have 1V across a 1/4 watt metal film 1k resistor for a milliwatt of signal dissipation? Let's assume a resistor with 25ppm TC and 20Hz.
A typical indicative figure for a MiniMELF thin-film part with 250 mW and 50 ppm tempco is -125 dB 3rd harmonic at 60 mW and 20 Hz. Distortion is directly proportional to power, and a usable approximation for the frequency dependence is -10 dB/decade.
Samuel
I can see gain stabilization from matching the tempco of the divider (long been done in precision AC calibrators) but a waveform interaction will not necessarily cancel. It could get multiplied.
Distortion from thermal self-modulation is mainly 3rd harmonic, i.e. the resistance modulation is equal at positive and negative peaks of the sine wave. If one leg of a divider is at its peak dissipation so is the other. Thus there must be cancellation, not addition, if the tempcos match.
Addition occurs if the legs have opposite tempcos (e.g. +15 ppm and -15 ppm); so far I have no reliable data how tempco is distributed. That makes it hard to guess how effective the cancellation strategy actually is. Perhaps low-tempco parts have a tighter distribution, as possibly these are trimmed for low tempco, making the technique more effective than for standard parts.
Samuel
A typical indicative figure for a MiniMELF thin-film part with 250 mW and 50 ppm tempco is -125 dB 3rd harmonic at 60 mW and 20 Hz. Distortion is directly proportional to power, and a usable approximation for the frequency dependence is -10 dB/decade.
Samuel
Samuel,
Well that begs the question, how do the Vishay Bulk foils compare?
- Home
- Design & Build
- Equipment & Tools
- Low-distortion Audio-range Oscillator