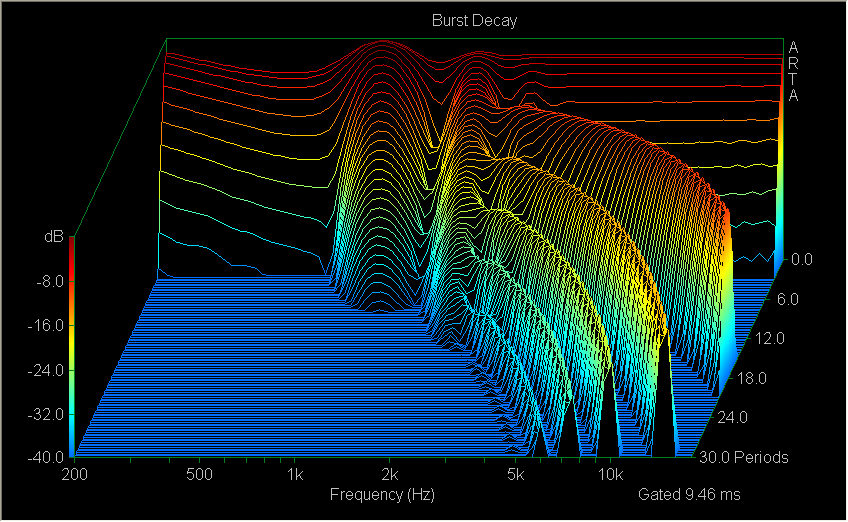
Below again for the four "honkers" of mine the wavelet analysis by ARTA (burst decay)
Basically we do not get a better picture regarding those quarter wave reflections – sadly not even in the "time preference mode" – partly because the resolution is bad when referenced in periods (as already said), but especially as the reflections seen are way too misleading when not starting out from normalized peak SPL
This is most pronounced seen for the 60deg "honker" – almost no reflections in the crucial pass band to be seen, as the SPL is way down compared to other frequencies :
conical 0 deg included (quarter wave transmission line - no round over)

conical 60 deg included (no round over)

conical 120 deg included (no round over)

conical 180 deg included (open baffle - no round over)


Bottom line – way too misleading visualisation to be useful for judging reflection behaviour ...

Michael
Basically we do not get a better picture regarding those quarter wave reflections – sadly not even in the "time preference mode" – partly because the resolution is bad when referenced in periods (as already said), but especially as the reflections seen are way too misleading when not starting out from normalized peak SPL
This is most pronounced seen for the 60deg "honker" – almost no reflections in the crucial pass band to be seen, as the SPL is way down compared to other frequencies :
conical 0 deg included (quarter wave transmission line - no round over)
conical 60 deg included (no round over)
conical 120 deg included (no round over)
conical 180 deg included (open baffle - no round over)
Bottom line – way too misleading visualisation to be useful for judging reflection behaviour ...
Michael
Last edited:
I agree with Mige0 for the need for a "push button" analysis both for the CSD and for the multiresolution wavelets analysis.
Had a look into commercial software that claims to do so – and in fact provides as many a bunch of push button visualisation tools as you like – wavelet analysis included.
http://www.sigmaplot.com/products/autosignal/autosignal.php
In the end of the day I didn't get anything close to Elias' analysis IMO (could be I didn't find the right buttons to press though
), but stumbled over a lot of quirks and even crashes – so I really don't know who want to pay that high a price for such softwareBelow is the "as good as it gets" AutoSignal wavelet analysis of the
conical 0 deg included (quarter wave transmission line - no round over)

Well – at least we see *some* reflections of the transmission line being visualized in the time domain...
But we totally miss the transition into the ragged frequency response and a lot of details I expect to see too
No way to do normalized plots as well (as far as I found out)
Michael
Last edited:
But we totally miss the transition into the ragged frequency response and a lot of details I expect to see too
Might be I've cut the peaks (the red plain) – so the rugged FR can't be seen – will have a look into that later...
I think wavelet analysis is more valuable using real music.
Don't think so...
I expect to see a clearly visible grid (or decay steps) pattern for a "quarter wave honk" from my "0deg honker" like for the synthetically generated impulses here – just not starting out as smooth as there is lack of energy at certain frequencies even at the very beginning (this way, my SPICE simu was misleading):
http://www.diyaudio.com/forums/multi-way/161627-horn-honk-wanted-6.html#post2120151
http://www.diyaudio.com/forums/multi-way/161627-horn-honk-wanted-6.html#post2121293
http://www.diyaudio.com/forums/multi-way/161627-horn-honk-wanted-6.html#post2122009
An externally hosted image should be here but it was not working when we last tested it.
*If* we are not able to get a clear visualisation of that "quarter wave honk pattern" how should we identify it as spurious in more complex contours (besides equally spaced dips and peaks in FR)?
I mean – this quarter wave honk was "hidden" long enough – no ?
Michael
Last edited:
Hello Catapult,
You'll find in attached file an ASCII file that you can import in ARTA. This is the impulse response of a Butterworth high-pass filter of the 4th order with an Fc of 1kHz.
Best regards from Paris,
Jean-Michel Le Cléac'h
You'll find in attached file an ASCII file that you can import in ARTA. This is the impulse response of a Butterworth high-pass filter of the 4th order with an Fc of 1kHz.
Best regards from Paris,
Jean-Michel Le Cléac'h
Could you post a PIR or WAV of your Butterworth impulse so I could play with it in ARTA?
Attachments
"Arta doesn't allow us to choose the number of frequencies at which the sliding FFT is performed so the resolution is a bit weak."
???
FFT length(size) IS the number of frequency bands you get out, no more no less.
Do you mean the the frequency (time between samples) of the moving window?
Hello David,
There is a need for uniformisation of how the parameters for the CSD (Arta) or the spectrogram (Adobe audition) are named.
You'll find in atatched file 3 spectrograms of the impulse response of a Butterworth 4th order HP filter at 1kHz obtained using 3 different settings of the spectrogram in Adobe Audition.
The parametering window use 2 mains parameters : the "resolution" which is expressed in number of bands and the "width of the window" expressed in %.
Best regards from Paris, France
Jean-Michel Le Cléac'h
"Arta doesn't allow us to choose the number of frequencies at which the sliding FFT is performed so the resolution is a bit weak."
???
FFT length(size) IS the number of frequency bands you get out, no more no less.
Do you mean the the frequency (time between samples) of the moving window?
Attachments
Hello Michael,
I don't see why the first pulse should be bad with a 0° horn ( = tube=... there is no reason for that , it should look similar to the power response of the driver.
Until the first reflection nothing bad can happens to the tube response.
The comb effect we can see on the CSD between the first pulse and the first refelction cannot be perceived before we ear the "first reflection".
I don't think there is much more to learn on you CSD ( a first reflection with high frequency attenuated, then a second refelction with an higher Q and the comb effests due to interferences between the first pulse and the first reflection (eventually with some interferences with the second reflection).
You have discovered that it will be more difficult to see reflections in small horns or tubes...
I attached a graph showing the relation between the CSD and the impulse waveform. For what its worth...
Much more intersting should be to map the first reflection(s) at a given radius from the throat in order to identify Homs...
Best regards from Paris, France
Jean-Michel Le Cléac'h
I expect to see a clearly visible grid (or decay steps) pattern for a "quarter wave honk" from my "0deg honker" like for the synthetically generated impulses here – just not starting out as smooth as there is lack of energy at certain frequencies even at the very beginning (this way, my SPICE simu was misleading):
Attachments
Last edited:
Had a look into commercial software that claims to do so – and in fact provides as many a bunch of push button visualisation tools as you like – wavelet analysis included.
AutoSignal - Cutting Edge Signal Analysis Software
In the end of the day I didn't get anything close to Elias' analysis IMO (could be I didn't find the right buttons to press though
How is Elias doing it? Im still waiting for a response. I guess he does not want to give ou the secret. He didnt reply in this thread to my question about it or in PM.
Good luck.
.
Thanks
Though we possibly will need even more...
How is Elias doing it? Im still waiting for a response. I guess he does not want to give ou the secret. He didnt reply in this thread to my question about it or in PM.
Yes I would love to see his response too – but on the other hand he might have very good reasons not to tell anything and also – lets not forget - he already has contributed a awful lot here !
I don't see why the first pulse should be bad with a 0° horn ( = tube=... there is no reason for that , it should look similar to the power response of the driver.
...
The comb effect we can see on the CSD between the first pulse and the first refelction cannot be perceived before we ear the "first reflection".
...
I attached a graph showing the relation between the CSD and the impulse waveform. For what its worth...

Thanks for the pix – very intuitively as well!
Sure and I agree - that's why I made the point that we are in need of different EQing at different times when dealing with horns that have pronounced "quarter wave honk".
But on the other hand there already is part of the energy missing *from the very beginning* - that part that gets reflected back into the horn like from a half mirror.
That part (the reflected one) *should* be completely independent of frequency (HP filtered at best - at least not rugged) IMO ? – but I simply don't know for sure ..
I don't think there is much more to learn on you CSD ( a first reflection with high frequency attenuated, then a second refelction with an higher Q and the comb effests due to interferences between the first pulse and the first reflection (eventually with some interferences with the second reflection).
I fully agree – but IMO we are in need of a better visulaisation than that CSD – so see it as kind a negative example...
BTW here is the "corrected" plot from that commercial software (top not cut this time
) – still not what I would like to see in resolution but we get a basic idea of the grid / steps caused by quarter wave reflections at least.Also its *NOT* log in frequency axis to better show the equally spacing from comb filtering...

above again - conical 0 deg included (quarter wave transmission line - no round over)
Much more intersting should be to map the first reflection(s) at a given radius from the throat in order to identify Homs...
I don't think so – as this "HOM woodoo" is nothing else that the same interference / comb filtering we are investigating in here – in addition to CD deviations over polars - but if you are interested in some additional work I certainly would support you as far as I can – what files are you interested in ?
I have measured polars of 0 through 60 deg on all of my "honkers" in 10deg increments - if that's of any help?
##########
What *I* am much more interested in is to have a closer look at if we possibly get *additional* intermodulation distortion by that quarter wave honk.
You know I've done some quite interesting work on back diaphragm mirror distortion that showed such increase.
Hadn't time to think through, if this same mechanism could partly apply with that facet of honk as well
Michael
Last edited:
Hello,
I think that HOMs will look different on CSD or alike than reflections from mouth to throat.
Specifically I think that the delay of one mode order from the main direct pulse will be frequency dependant .
If we take the wavelet as Elias do as an example HOMs will not appear as vertical thin strips but as curves.
But to differentiate them from reflections from mouth to throat, mapping at a given radius from throat will be better IMHO.
(For sure Homs can also be reflected... but that's another story)
Intuitively I'll say that the relation between intermodulation and reflections will probably show a comb effect. Higher for given frequencies, smaller for others...
Best regards from Paris, France
Jean-Michel Le Cléac'h.
I don't think so – as this "HOM ghost" is nothing else that the same interference / comb filtering we are investigating in here – in addition to CD deviations - but if you are interested in some additional work I certainly would support you as far as I can – what files are you interested in ?
I have measured polars of 0 through 60 deg on all of my "honkers" in 10deg increments - if that's of any help?
Member
Joined 2003
Yes I would love to see his response too – but on the other hand he might have very good reasons not to tell anything and also – lets not forget - he already has contributed a awful lot here !
Michael
Great stuff Michael,
I agree he has contributed a ton here but if its not proprietary stuff then others could help him.
If it is proprietary then just post that it is. I can not see how it its though. Octave is free and I can get that working, Wavelab is free and I can load it and start to use it for simply graphics but that is where Im stuck. I can not generate this wavelet.
Hello Michael,
See in attached file the spectrogram I obtained using Adobe Audition on your file Honker_0deg...
Best regards from Paris, France
Jean-Michel Le Cléac'h
See in attached file the spectrogram I obtained using Adobe Audition on your file Honker_0deg...
Best regards from Paris, France
Jean-Michel Le Cléac'h
BTW here is the "corrected" plot from that commercial software (top not cut this time
Also its *NOT* log in frequency axis to better show the equally spacing from comb filtering...
above again - conical 0 deg included (quarter wave transmission line - no round over)
Attachments
I confess, I do not understand. What info is presented in Wavelet that is not in CSD?
To me, at least so far, wavelet looks like CSD from a different viewing angle...looking straight down from above rather than oblique/3D perspective of CSD. What am I overlooking?
The main difference in wavlet based analysis it that we can have (in theory and as shown by the examples) increased resolution compared to Fourier based analysis (waterfall / CSD sonogram that is ).
I'm certainly not the math head to explain why exactly this is (any further as said ) but you can look up here - if you are interested :
- help file of AutoSignal Software (seriousely !)
- http://www.hpl.hp.com/techreports/92/HPL-92-124.pdf
- http://atoc.colorado.edu/research/wavelets/wavelet1.html
- http://ion.researchsystems.com/cgi-bin/ion-p?page=wavelet.ion&elnino.x=31&elnino.y=23
- http://www.toolsmiths.com/p/wavbox.aspx
- http://users.rowan.edu/~polikar/WAVELETS/WTpart1.html
- http://pagesperso-orange.fr/polyvalens/clemens/wavelets/wavelets.html
This is for quiet hours...
– below you may see more easily what I' referring to when comparing
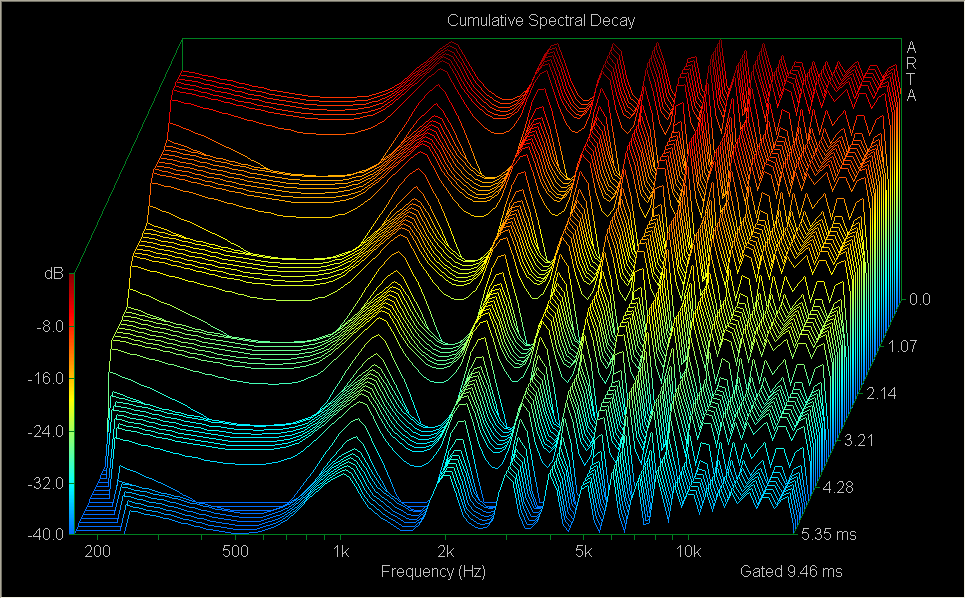
1. CSD (!!!) sonogram as recommended by Jean-Michel for lowest artefacts (upside down):
2. My very low level wavelet (!!!) analysis of the same "0deg honker":
and 3. JMLC' latest Audition plot (CSD or wavelet ? - I do not know )
The difference in pattern recognition capability should be obvious – no?
Elias' plots have been even more detailled...
The grid structure I was talking of is
1. equally spaced time of flight delays – in the horizontal here
2. equally spaced frequency ripples from comb filtering – in the vertical here (better seen with linear frequency axis)
We are actually doing nothing else than "data mining" (where wavelet analysis is also used !) meaning we are not only after the needle in the hey stack but after a clear picture what that needle may look like at first hand – visualized in the common time and frequency domain.
So – in the end this wavelet analysis is nothing else than a biiiiiiiiiiiiig NEO-magnet and the Fourier based CSD is a big ceramcic- magnet.
Both will possibly bring up some rusty nails we are not interested in too - what counts IMO is which method provides (and also is able within its theoretical limitations (!) to provide ) the clearer picture
Michael
Last edited:
Hello Michael,
You'll see in the attached file a graph (corresponding to your "Honker_0deg") that most probably you'll take as a "wavelets graph" like Elias'ones.
It is an output from a run of a piece of software I once wrote in Matlab language at a time I never considered wavelets. (I did "wavelets" without knowing "wavelets")
In fact it used a Morlet pulse (sine/cosine with a bell shaped window) having a variable width with frequency (width = a fixed number of periods) and TFD (not FFT). Using TFD you can use whatever frequency scale and resolution you want. The low resolution of common CSD is due to the use of FFT. In A CSD with a logarithmic frequency axis you don't need 24000 frequency steps, only 300 to 400 are needed, so to use TFD is not time consuming.
Notice: in the Impulse Response module I once wrote for David Mc Bean and which is used in Hornresp the reconstruction of the Impulse Response is based on a "quasi" inverse TFD using a Morlet wavelet the width of which is variable in frequency. May be I can call this "IR reconstruction with wavelets" ;-)
In fact when wavelets are used with sine/cosine based symetrical wavelets the problem becomes quasi similar to sliding TFD... (there is a continuum).
Best regards from Paris,France.
Jean-Michel Le Cléac'h
(I can give freely the Matlab code but many improvements has to be done on it as correct axis ticks, easier choice of look up table...)
The main difference in wavlet based analysis it that we can have (in theory and as shown by the examples) increased resolution compared to Fourier based analysis (waterfall / CSD sonogram that is ).
Attachments
Last edited:
Hello Michael,
You'll see in the attached file a graph (corresponding to your "Honker_0deg") that most probably you'll take as a "wavelets graph" like Elias'ones.
It is an output from a run of a piece of software I once wrote in Matlab language at a time I never considered wavelets. (I did "wavelets" without knowing "wavelets")
In fact it used a Morlet pulse (sine/cosine with a bell shaped window) having a variable width with frequency (width = a fixed number of periods) and TFD (not FFT). Using TFD you can use whatever frequency scale and resolution you want. The low resolution of common CSD is due to the use of FFT. In A CSD with a logarithmic frequency axis you don't need 24000 frequency steps, only 300 to 400 are needed, so to use TFD is not time consuming.
Notice: in the Impulse Response module I once wrote for David Mc Bean and which is used in Hornresp the reconstruction of the Impulse Response is based on a "quasi" inverse TFD using a Morlet wavelet the width of which is variable in frequency. May be I can call this "IR reconstruction with wavelets" ;-)
In fact when wavelets are used with sine/cosine based symetrical wavelets the problem becomes quasi similar to sliding TFD... (there is a continuum).
Best regards from Paris,France.
Jean-Michel Le Cléac'h
(I can give freely the Matlab code but many improvements has to be done on it as correct axis ticks, easier choice of look up table...)
Thanks, Jean-Michel.
Very much appreciated – I consider this to be a gorgeous gift to the community !

You can email me the code or publish it here or in the
http://www.diyaudio.com/forums/soft...n-wavelet-analysis-available.html#post2126399
thread.
When making it available, you may want to consider, how to permanently protect the code "for free", if that's in your intention.
I definitely would like to see a dedicated collaborative thread developing towards easy usage of wavelet analysis and certainly would not mind if that code finally gets adopted to any free or commercial software like ARTA or HolmImpulse or SoundEasy or whatever - but – crazy world we live in – we should give it a thought or two on how to protect any results from being overtaken and covered by patents - by some "greedy Bill" - after possibly a lot of people have put their effort into, to make this code handy.
Might be a GNU statement (or whatever will be appropriate) will be sufficient to be claimed at the beginning of a collaborative thread ? – I simply don't know....
Just my 2ct - what you think ?
Michael
Last edited:
Hello,
It's a busy life! I would like to do more wavelets than I have time for..
For a looong time I've been thinking to start a thread on 'How-To' with wavelets, and more specifically how to do it free with Octave But then no time..
The thing is I have a full audio measurement system coded with Octave and it's about 3000 lines of code written over the years. The wavelet is only a small part of it, the code measures and calculates millions of other things as well. The code is not very modular though, so separating the wavelet from it and making it work universally with any set of data by any user would require rewriting that part.
Meanwhile here's some reading about different time-frequency methods and their possible applications:
http://www.listeninc.com/PDFs/paper_123AES_Time-Frequency_Analysis.pdf
- Elias
It's a busy life!
I would like to do more wavelets than I have time for.. For a looong time I've been thinking to start a thread on 'How-To' with wavelets, and more specifically how to do it free with Octave
But then no time.. The thing is I have a full audio measurement system coded with Octave and it's about 3000 lines of code written over the years. The wavelet is only a small part of it, the code measures and calculates millions of other things as well. The code is not very modular though, so separating the wavelet from it and making it work universally with any set of data by any user would require rewriting that part.
Meanwhile here's some reading about different time-frequency methods and their possible applications:
http://www.listeninc.com/PDFs/paper_123AES_Time-Frequency_Analysis.pdf
- Elias
- Status
- This old topic is closed. If you want to reopen this topic, contact a moderator using the "Report Post" button.
- Home
- Loudspeakers
- Multi-Way
- Horn Honk $$ WANTED $$