If you are talking about your posted plot it looks like you are not gating before the pulse or after your first room reflection. You also are using a different dB scale for the decay. Try to match his period for the measurement and decay scale and see what happens. Hope this helps.
Thanks Rob !
I'm not really referring to any specific CSD that I've posted to date .
I've tried gating some ( & you're correct , I usually don't because I prefer to just move the mic in a bit ) . I'm sure that's part of it . I've matched scales as best as I can / still no love

Within ARTAs CSD control window there are a few options that have kept me busy trying out the various permutations & combinations / so far pretty close /but nothing exacting ( as far as a real duplicate ).
I can't even replicate the CSD sonogram that JM made of my own data ! ( shown above )
<> cheers EarlK
ps ; Rob , you should download ARTA & try it out for yourself ( if you haven't already ).
- I find the various programs have their own strengths & weaknesses / which in the end, becomes a learning experience just navigating through them .
Last edited:
OK, I actually managed to steal some time to run measurements.
Here they are, as impulse files. I've given you 2 milliseconds before the pulse and 10 after it. Let e know if this works.
All measurements were done in a run. No change in mic position, feed or amp levels, nothing. So as close as I can get them. Some care was taken to reduce reflections. If there are any mic stand reflections, they should come at ~19cm & 120cm from the peak. (Round trip from mic capsule to stand and back.)
All horns were tested on the same Altec 806A driver, then the screw type also tested on Selenium D210Ti. The Altec 806 is known for its lack of top end, which you will clearly see. Easy to correct with 1 cap or a shelving filter.
Tested were:
Altec 511B
Altec 811B
Dayton 12x8" bolt on horn
Dayton 12" round waveguide
Dayton 8" round waveguide
Dayton 6x6" oval waveguide
All signals are swept sine high pass filtered (active) at 400Hz Butterworth.
I also did impedance sweeps of all horns and drivers in both open mouth and with a layer of cardboard at the the mouth.
Hope this shows you some honk. I'll post the impedance stuff later if I get a chance.
Attachments
Hello,
Here comes first set of wavelet results for the IRs of OS and JBL horns.
The actual difference between jbl_00.txt and jblh_00.txt was not clear to me, taking into account almost no difference in plots.
On the right hand side is response normalised to 0dB at every frequency. It's better to see the normalised responses if you want to compare temporal effects!
First JBL:
jbl_00.txt:
jblh_00.txt:
Then OS:
this is the original waveguide_00.txt:
and here's the 'less noise' waveguide.txt:
Apparently JBL and OS had different drivers. It can explain some of the differences. It's clear when a vendor advertises his product one may think better driver is used for his product than for the competitor's product.
Then other interesting measurement. There was also another IR file for Le Cléac'h J321 with TAD2001
td2001_j321_u.txt:
I think J321 response looks more 'straight' and balanced than OS or JBL.
- Elias
Here comes first set of wavelet results for the IRs of OS and JBL horns.
The actual difference between jbl_00.txt and jblh_00.txt was not clear to me, taking into account almost no difference in plots.
On the right hand side is response normalised to 0dB at every frequency. It's better to see the normalised responses if you want to compare temporal effects!
First JBL:
jbl_00.txt:
An externally hosted image should be here but it was not working when we last tested it.
jblh_00.txt:
An externally hosted image should be here but it was not working when we last tested it.
Then OS:
this is the original waveguide_00.txt:
An externally hosted image should be here but it was not working when we last tested it.
and here's the 'less noise' waveguide.txt:
An externally hosted image should be here but it was not working when we last tested it.
Apparently JBL and OS had different drivers. It can explain some of the differences. It's clear when a vendor advertises his product one may think better driver is used for his product than for the competitor's product.
Then other interesting measurement. There was also another IR file for Le Cléac'h J321 with TAD2001
td2001_j321_u.txt:
An externally hosted image should be here but it was not working when we last tested it.
I think J321 response looks more 'straight' and balanced than OS or JBL.
- Elias
Attachments


Hello Elias,
I see many similarities between your multiresolution wavelets graph and my CSDs. Is there any feature that you can see on your wavelt (for the JBL and the OS Waveguide) that we fail to see on the CSDs?
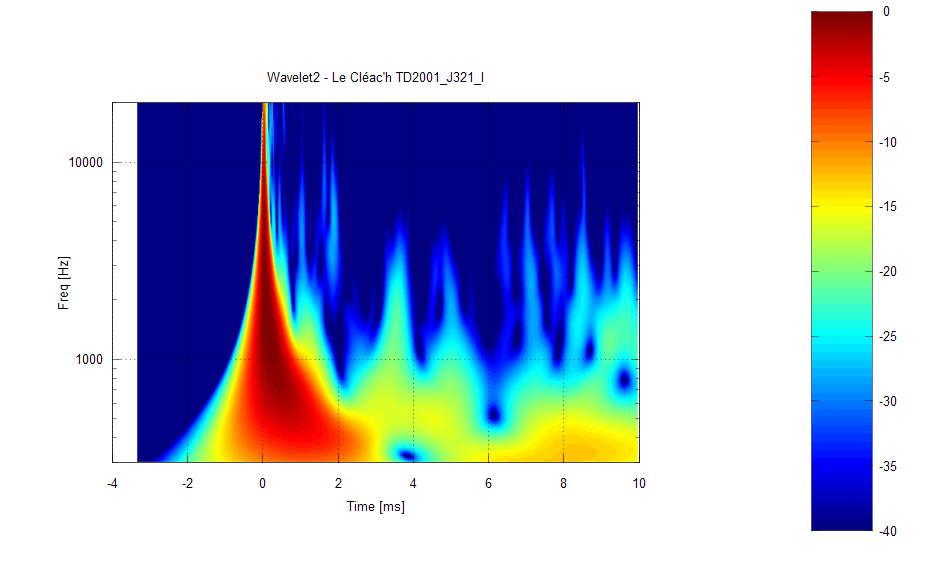
About the file td2001_j321_u.txt this is the pulse response for a voltage driven TD2001 mounted on one of my Le CLéac'h horn Fc = 320Hz (it was built and commercialized by Marco Henry under the name Jerzual321 or J321).
The td2001_j321_i.txt pulse response previously seen
http://www.diyaudio.com/forums/atta...1268301562-horn-honk-wanted-td2001_j321_i.txt
http://www.diyaudio.com/forums/atta...-le_cleach_td2001_j321_i_300-20k_wavelet2.png
in that thread is for a current driven TD2001 mounted on the same Le CLéac'h horn. The current drive allow to fill the famous hole around 1600-1900Hz which is a characteristic of the TD2001 (anti resonance due to the cavity behind the coil gap according to Kinoshita).
Best regards from Paris, France
Jean-Michel Le Cléac'h
I see many similarities between your multiresolution wavelets graph and my CSDs. Is there any feature that you can see on your wavelt (for the JBL and the OS Waveguide) that we fail to see on the CSDs?
About the file td2001_j321_u.txt this is the pulse response for a voltage driven TD2001 mounted on one of my Le CLéac'h horn Fc = 320Hz (it was built and commercialized by Marco Henry under the name Jerzual321 or J321).
The td2001_j321_i.txt pulse response previously seen
http://www.diyaudio.com/forums/atta...1268301562-horn-honk-wanted-td2001_j321_i.txt
http://www.diyaudio.com/forums/atta...-le_cleach_td2001_j321_i_300-20k_wavelet2.png
in that thread is for a current driven TD2001 mounted on the same Le CLéac'h horn. The current drive allow to fill the famous hole around 1600-1900Hz which is a characteristic of the TD2001 (anti resonance due to the cavity behind the coil gap according to Kinoshita).
Best regards from Paris, France
Jean-Michel Le Cléac'h
Here comes first set of wavelet results for the IRs of OS and JBL horns.
Then other interesting measurement. There was also another IR file for Le Cléac'h J321 with TAD2001
td2001_j321_u.txt:
An externally hosted image should be here but it was not working when we last tested it.
Last edited:
Hello EarlK,
You'll find in attached file a screen copy showing the position of the cursor (yellow line) and the parameters you can use in order to obtain a good CSD of your impulse response.
(notice: as your mesaurement doesn't need any, no marker before the first room refelction has been used ....)
I agree with Mige0 for the need for a "push button" analysis both for the CSD and for the multiresolution wavelets analysis.
Best regards from Paris, France
Jean-Michel Le Cléac'h
I can't even replicate the CSD sonogram that JM made of my own data ! ( shown above )
Attachments

Indeed so, JBL with $40 titanium-diaphragm Selenium D220Ti vs. OS with $120 B&C polyimide (Kapton, I believe) DE250.Apparently JBL and OS had different drivers. It can explain some of the differences. It's clear when a vendor advertises his product one may think better driver is used for his product than for the competitor's product.
I believe the conclusions are the same as back then. Is there a way to extract the difference between "low noise" OS and the original, then subtract that from the JBL original, since both originals were measured with the same noisy system, to generate a simulated "low noise" JBL wavelet?
It's apparent why I am a champion of normalization; they're not apples and apples otherwise, and there is evidence that the "standard" should incorporate a specific driver, such that the apples are all the same variety, as well.....
Last edited:
Hello,
You'll see in the attached graph a comparison of the CSD and the multiresolution wavelet analysis obtained on the OS waveguide IR.
For the wavelet graph, I took Elias's graph and selected the zone seen on the CSD then I redimensionned the X and Y scale in order for the 2 grap to be compared.
Apart some extra resolution for the wavelet analysis, there is no fundamental difference in the way both graph may be intrepreted.
Best regards from Paris, France
Jean-Michel Le Cléac'h
Hello Elias, I see many similarities between your multiresolution wavelets graph and my CSDs.
Attachments

Hello Panomaniac,
Here attached in a single zipped file the 6 CSD corresponding to your IRs.
Best regards from Paris, France
Jean-Michel Le Cléac'h
Here attached in a single zipped file the 6 CSD corresponding to your IRs.
Best regards from Paris, France
Jean-Michel Le Cléac'h
Altec 511B
Altec 811B
Dayton 12x8" bolt on horn
Dayton 12" round waveguide
Dayton 8" round waveguide
Dayton 6x6" oval waveguide
Attachments
they're not apples and apples otherwise, and there is evidence that the "standard" should incorporate a specific driver, such that the apples are all the same variety, as well.....
That's why I propose an equalized impedance curve.
I'ts easy, I used an 1 meter tube (or more for better resolution in low frequency), I use a little piece of marble for close the tube and I take the first echo for generate a frd file to calibrate the microphone (the driver).
The procedure in french (a lot of graph):
Mise en évidence expérimentale de la réflexion d'un pavillon acoustique: Le retour.
In illustration N°3 in green an open tube, in red a closed tube, first echoes.
I'm not partisan of measure what I hear, but to know how it works.
Jmmlc said:Hello EarlK,
You'll find in attached file a screen copy showing the position of the cursor (yellow line) and the parameters you can use in order to obtain a good CSD of your impulse response.
(notice: as your mesaurement doesn't need any, no marker before the first room refelction has been used ....)
I agree with Mige0 for the need for a "push button" analysis both for the CSD and for the multiresolution wavelets analysis.
Best regards from Paris, France
Jean-Michel Le Cléac'h
Thank-you JM , the guidance is very much appreciated .
<> EarlK
Merci J-M. Very nice. They all look different, but it's hard to say where the honk is, or is not.
Just from this, I'd say that the Dayton 12x8" horn looks the best. Followed by the Altec 811. These two horns are similar in size and shape.
When I return on Wednesday, I will take a look at the CSDs compared to the impedance plots.
Just from this, I'd say that the Dayton 12x8" horn looks the best. Followed by the Altec 811. These two horns are similar in size and shape.
When I return on Wednesday, I will take a look at the CSDs compared to the impedance plots.
Merci J-M. Very nice. They all look different, but it's hard to say where the honk is, or is not.
Just from this, I'd say that the Dayton 12x8" horn looks the best. Followed by the Altec 811. These two horns are similar in size and shape.
When I return on Wednesday, I will take a look at the CSDs compared to the impedance plots.
Do any of them honk to you?
btw, I do agree that they Dayton looks the cleanest.
Hello,
You'll see in the attached graph a comparison of the CSD and the multiresolution wavelet analysis obtained on the OS waveguide IR.
....
Apart some extra resolution for the wavelet analysis, there is no fundamental difference in the way both graph may be intrepreted.
Gave it an hour or two to come as close as I could get:
http://www.kinotechnik.edis.at/pages/diyaudio/GD_HighPass/honk_wanted/waveguide_less.noise.pir
First with 128 FFT length


now with 256 FFT length


There is a interesting difference in the 2.5 –7 kHz range in how the two visulalisation tools perform.
I have no ideas which one is "right" - what you think ?
###########
Elias your normalized plots alongside are an excellent idea – wish ARTA could do
Michael
Last edited:
Hello,
The 256 version of your CSDs has a flat top that I don't like and subsequent artifacts on left side...
If the CSD tool in ARTA would have twice the number of frequency channels it's appearance would be nearly the same as the wavelets graph.
I would like to see such a multiresolution wavelets graph in ARTA but only if it reveals itself easy to use. For the moment I think the CSD tool in ARTA is sufficient for most purposes but it seems to be a bit painful to use by many.
At least, looking at you last CSDs you seem to begin to be easy with this tool. ;-)
(Good idea to use a FFT block shift value of 1 and a number of block of 200, the graph is smoother...)
Best regards from Paris, France
Jean-Michel Le Cléac'h
now with 256 FFT length
There is a interesting difference in the 2.5 –7 kHz range in how the two visulalisation tools perform.
I have no ideas which one is "right" - what you think ?
Last edited:
Hello,
In order to show how the FFT length influence the shape of the CSD I took the pulse response from a Butterworth 4th order high-pass filter having F-3dB at 1kHz.
I did, under ARTA, three CSDs graphs using different FFT lengths (in the "CSD parameters" window).
You'll see on the attached file 3 CSDs obtained respectively using FFT lengths of 128 ; 256 and 512 samples.
As you can see choosing a large value for the FFT length results in artifacts that I respectively called: "flat tops" and "wings".
The CSD obtained with an FFT length of 128 is devoid of those artifacts.
So if we summarize, in order to obtain a good CSD:
1) choose an FFT length having a small value (128 samples)
2) choose an apodizing rise time having a large value (1ms)
3) choose an FFT block shift having a small value (1 to 4 e.g.)
4) choose a max. number of FFT blocks such as the product with the FFT block shift is between 200 and 300 (e.g. depending on length of I.R.)
Best regards from Paris, France
Jean-Michel Le Cléac'h
Hello,
The 256 version of your CSDs has a flat top that I don't like and subsequent artifacts on left side...
Attachments

Last edited:
Very clever, Jean-Michel! I created the multiresolution wavelet to approximate CSD, to have better comparison with other forum members. Now you have approached it from the other direction You seem to be one of the few people who knows how to use CSD 
- Elias
I created the multiresolution wavelet to approximate CSD, to have better comparison with other forum members. Now you have approached it from the other direction You seem to be one of the few people who knows how to use CSD - Elias
You'll see in the attached graph a comparison of the CSD and the multiresolution wavelet analysis obtained on the OS waveguide IR.
For the wavelet graph, I took Elias's graph and selected the zone seen on the CSD then I redimensionned the X and Y scale in order for the 2 grap to be compared.
Apart some extra resolution for the wavelet analysis, there is no fundamental difference in the way both graph may be intrepreted.

I see many similarities between your multiresolution wavelets graph and my CSDs.
Wavelets are scalable => one can zoom in. Here's gedlee waveguide.txt from 4kHz-20kHz. One can investigate the driver performance.
There is a repetitive reflection pattern of about 180us. That's about 6cm. Supposedly it comes from back-forth reflection of 3cm distance somewhere from the driver, or from driver-horn matching interface.
Around 10kHz the reflections gets fuzzy, there's a resonance.
This one should be able to dublicate with CSD? (if software parameters allow)
- Elias
There is a repetitive reflection pattern of about 180us. That's about 6cm. Supposedly it comes from back-forth reflection of 3cm distance somewhere from the driver, or from driver-horn matching interface.
Around 10kHz the reflections gets fuzzy, there's a resonance.
An externally hosted image should be here but it was not working when we last tested it.
This one should be able to dublicate with CSD? (if software parameters allow)
- Elias
And now
Here's gedlee waveguide.txt from 500Hz-20kHz. By adjusting wavelet to increased time resolution, on can clearly see the mouth reflections. See the repetitions of the cluster at the rate of about 0.8ms. It's about 28cm, which is approximately throat-mouth-throath distance of the waveguide.
If mouth reflections are anyway related to Horn Honk, I can claim that gedlee waveguide is having some honk!
I want my prize now! €€€

- Elias
Here's gedlee waveguide.txt from 500Hz-20kHz. By adjusting wavelet to increased time resolution, on can clearly see the mouth reflections. See the repetitions of the cluster at the rate of about 0.8ms. It's about 28cm, which is approximately throat-mouth-throath distance of the waveguide.
If mouth reflections are anyway related to Horn Honk, I can claim that gedlee waveguide is having some honk!
I want my prize now! €€€
- Elias
Attachments

JM, your settings seem to work but I don't understand them (nothing new for meThe CSD obtained with an FFT length of 128 is devoid of those artifacts.
So if we summarize, in order to obtain a good CSD:
1) choose an FFT length having a small value (128 samples)
2) choose an apodizing rise time having a large value (1ms)
3) choose an FFT block shift having a small value (1 to 4 e.g.)
4) choose a max. number of FFT blocks such as the product with the FFT block shift is between 200 and 300 (e.g. depending on length of I.R.)
).48000/128 gives a 'real' frequency resolution of a data point every 375 Hz. That seems too coarse to be very useful.
128/48000 gives a sample length of 2.67 msec and then we are applying a filter/window with rise and fall times of 1 msec each.
First we threw away the low frequencies with the small sample and then we are throwing away the high frequencies with the large apodizing time. How are we left with any useful information?
Help!!!
Last edited:
- Status
- This old topic is closed. If you want to reopen this topic, contact a moderator using the "Report Post" button.
- Home
- Loudspeakers
- Multi-Way
- Horn Honk $$ WANTED $$