I don't think Burst Decay measurements should be gated, at least not a short gate. That will introduce its own artifacts. Better would be to build a small 'anechoic chamber' around the mic and the horn with pillows, foam, fiberglass, etc.
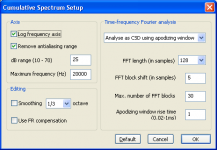
Or just use Jean Michel's settings for the CSD. I tried them and they worked well for me except I preferred it with the contour box unchecked. Move the cursor (no marker) on the impulse to get it to start where you want. Once you get JM's settings working well, change them one at a time to see what happens. If you change the settings, you'll probably need to move the cursor to catch the rise.


Or just use Jean Michel's settings for the CSD. I tried them and they worked well for me except I preferred it with the contour box unchecked. Move the cursor (no marker) on the impulse to get it to start where you want. Once you get JM's settings working well, change them one at a time to see what happens. If you change the settings, you'll probably need to move the cursor to catch the rise.
Attachments
Hello,
I calculated wavelets for the impulse responses. These are 2 cycle transforms, to maximise temporal resolution.
511 + 802:
511 + 806:
811 + 802:
811 + 806:
You are right, 802 driver is producing more garbage than 806") Combination 811 + 802 does not look very good, what do you think?
Combination 811 + 802 does not look very good, what do you think?
- Elias
I calculated wavelets for the impulse responses. These are 2 cycle transforms, to maximise temporal resolution.
511 + 802:
An externally hosted image should be here but it was not working when we last tested it.
511 + 806:
An externally hosted image should be here but it was not working when we last tested it.
811 + 802:
An externally hosted image should be here but it was not working when we last tested it.
811 + 806:
An externally hosted image should be here but it was not working when we last tested it.
You are right, 802 driver is producing more garbage than 806
Combination 811 + 802 does not look very good, what do you think?- Elias
OK, here is the data zipped up.
What's in the zip file is 4 impulse measurements in wav format, + a text document explaining test conditions.
I tested both the Altec 811 & 511 horns. Each horn was tested with the 806A and 802-8D driver. 1 meter, on axis. Average SPL 85dB. Sweep from 250Hz up, no high pass filter. EL34 P-P amp with L-Pad before horns.
Horns were set on top of Altec 828 bass cabinet (A7) as they would be in actual use.
To my ear, the 806 driver sounds much better on either horn. The measurements bear this out. The 806 has much lower distortion and a flatter response than the 802 with its "Symbiotic" fram. (I hope to test the light aluminum frams in the 802 soon).
If the same sonograms are run on these impulses, we should be able to see where the honk may be on each horn. Hopefully using 2 different drivers will allow us to see the horn better.
I can post burst decay graphs from Arta, if anyone is interested.
And here's the same as above but now normalised to 0dB at every frequency, to eliminate the differences in frequency responses and thus for better comparison.
511 + 802:
511 + 806:
811 + 802:
811 + 806:
Everyone can make their own conclusions But I think there is a heck lot of reflections/diffractions seen in these plots.
See how the room reflections carry all the horn artefacts in it (of course) and they get 'amplified' in perceptive sense! Maybe this is leading us somewhere to the origin of Horn Honk??
- Elias
511 + 802:
An externally hosted image should be here but it was not working when we last tested it.
511 + 806:
An externally hosted image should be here but it was not working when we last tested it.
811 + 802:
An externally hosted image should be here but it was not working when we last tested it.
811 + 806:
An externally hosted image should be here but it was not working when we last tested it.
Everyone can make their own conclusions
But I think there is a heck lot of reflections/diffractions seen in these plots.See how the room reflections carry all the horn artefacts in it (of course) and they get 'amplified' in perceptive sense! Maybe this is leading us somewhere to the origin of Horn Honk??
- Elias
I don't think Burst Decay measurements should be gated, at least not a short gate. That will introduce its own artifacts. Better would be to build a small 'anechoic chamber' around the mic and the horn with pillows, foam, fiberglass, etc.
Or just use Jean Michel's settings for the CSD. I tried them and they worked well for me except I preferred it with the contour box unchecked. Move the cursor (no marker) on the impulse to get it to start where you want. Once you get JM's settings working well, change them one at a time to see what happens. If you change the settings, you'll probably need to move the cursor to catch the rise.
Sure – but this was an easy example – but what about the measurement of the 60deg included conical without any treatment - I've posted *.pir file ?


Here I really would liked to have some order put into – no ?
Michael
Hello Michael,
Your Honker Horn looks interesting I have to try to analyse those impulse responses too.
What comes to ARTA, yes the time axis is in periods, and I believe the reason is, as stated also in somewhere in ARTA manual, that the intended purpose for such a time axis presentation is to make more 'perceptionally comparable' results for resonances. I.e. it's not suited for reflection/diffraction analysis as it is now.
Should be no problem for Mateljan to convert the time axis. If he calculates the wavelet transform 'conventionally' that is with mathematical equivalency of convolution, the time axis automatically yields linear time. From this it's easy to do the axis transform to periods. If, however, he does some 'tricks' in wavelet transform to achieve directly the period time axis, then going back to linear time may not be possible easily.
Also the normalisation to 0dB at every frequency is straight forward. At least in Octave it takes only one line of code
- Elias
Your Honker Horn looks interesting
I have to try to analyse those impulse responses too.What comes to ARTA, yes the time axis is in periods, and I believe the reason is, as stated also in somewhere in ARTA manual, that the intended purpose for such a time axis presentation is to make more 'perceptionally comparable' results for resonances. I.e. it's not suited for reflection/diffraction analysis as it is now.
Should be no problem for Mateljan to convert the time axis. If he calculates the wavelet transform 'conventionally' that is with mathematical equivalency of convolution, the time axis automatically yields linear time. From this it's easy to do the axis transform to periods. If, however, he does some 'tricks' in wavelet transform to achieve directly the period time axis, then going back to linear time may not be possible easily.
Also the normalisation to 0dB at every frequency is straight forward. At least in Octave it takes only one line of code
- Elias
First measurements of conical dipole horns on NEO3W without any round over to possibly get the most horn honk ever.
.......
Above "burst decay" visualisation in ARTA is a wavelet analysis too, but I really would wish for the scaling of the axis as "time" rather than in "periods".
Also a "normalisation" function would be extremely helpful to get the picture clean IMO – meaning not to get trapped by peaks in the frequency response that possibly stick out later on too...
And here's the same as above but now normalised to 0dB at every frequency, to eliminate the differences in frequency responses and thus for better comparison.
....
See how the room reflections carry all the horn artefacts in it (of course) and they get 'amplified' in perceptive sense! Maybe this is leading us somewhere to the origin of Horn Honk??
Also the normalisation to 0dB at every frequency is straight forward. At least in Octave it takes only one line of code
Great work !

Last edited:
Your Honker Horn looks interesting
LOL
I'll probably will have to repeat measurement with a foam plug ?
Michael
Hello,
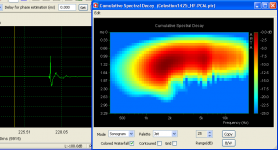
In CSD the 'ringing' continues as long as the last reflection dies out, because in CSD there is no temporal reolution finer than the FFT window width. What is seen in the CSD plot, it may not be a real resonance at all, but appears as such because of limited temporal resolution of the method.
I think CSD is a good method to mask the data from the observer Well, to be fair sometimes it can give some information, too.
- Elias
In CSD the 'ringing' continues as long as the last reflection dies out, because in CSD there is no temporal reolution finer than the FFT window width. What is seen in the CSD plot, it may not be a real resonance at all, but appears as such because of limited temporal resolution of the method.
I think CSD is a good method to mask the data from the observer
Well, to be fair sometimes it can give some information, too.- Elias
Hi Earl, hi Zilch
impressive plots - but how you think these loooooong decays - in steps even - come from?
Also those resonances are veeery close to each other ??
Does not look like a usual horn or quarter wave behaviour to me - any conclusions or theories ? - maybe material resonance (the metal bars ?) of the horn contour?
How was measurement setup ?
Michael
I'll probably will have to repeat measurement with a foam plug ?
But that would kill the HOM??
Jack Bouska noted that it's informative to plot on a linear frequency scale to see the throat-mouth reflections. I don't know if this shows that or not but there does seem to be somewhat even spacing going on starting with the strong one at 500. This is ungated (cursor set but not the marker.)Sure – but this was an easy example – but what about the measurement of the 60deg included conical without any treatment - I've posted *.pir file ?
Attachments
Jack Bouska noted that it's informative to plot on a linear frequency scale to see the throat-mouth reflections. I don't know if this shows that or not but there does seem to be somewhat even spacing going on starting with the strong one at 500. This is ungated (cursor set but not the marker.)
Ok, yes – thanks for reminder – looks like artwork inspired by NY skyline that way - who would have thought that there's so much buried beauty in this honk thing – what you think ?

Michael
Last edited:
Thanks Elias for the really great plots! That shows a lot. Yes, the poor 802 with the Symbiotic fram looks bad in your plots, too. No matter how you measure or listen to it, it's bad. =(
In all the plots you did we can see a hot spot at about 5.5mS. I can easily see this in the impulse file. My guess is that it is a room reflection (side wall), tho it comes sooner than I would expect.
There is a smaller reflection at about 2mS on all my measurements too. It could be the mouth reflection, tho it does not really measure out for a round trip from mouth to driver and back. Close, but not exact.
So I will have to play with foam and other things as Michael suggests to see if those kinks in the impulse can be identified. Will be nice to know what they are.
************
So.... from those plots, do we see Honk? I can't identify it (yet). The driver makes more difference than the horn. Too bad I don't have my paper tractrix horns any more. They might tell another story.
Yes, the poor 802 with the Symbiotic fram looks bad in your plots, too. No matter how you measure or listen to it, it's bad. =(In all the plots you did we can see a hot spot at about 5.5mS. I can easily see this in the impulse file. My guess is that it is a room reflection (side wall), tho it comes sooner than I would expect.
There is a smaller reflection at about 2mS on all my measurements too. It could be the mouth reflection, tho it does not really measure out for a round trip from mouth to driver and back. Close, but not exact.
So I will have to play with foam and other things as Michael suggests to see if those kinks in the impulse can be identified. Will be nice to know what they are.
************
So.... from those plots, do we see Honk? I can't identify it (yet). The driver makes more difference than the horn. Too bad I don't have my paper tractrix horns any more. They might tell another story.
Here follows some more "beauty".
2 cycle wavelet responses normalised to 0dB at every freq.
Michael's 60deg horn:
120deg horn:
Well..
And here with longer time axis up to 10ms. See the room reflections hit after 4ms, carrying from every directions all that beautiful honk into your ears
60deg horn:
120deg horn:
One can also see from the room reflection pattern the difference in the directivity of the two horns.
- Elias
2 cycle wavelet responses normalised to 0dB at every freq.
Michael's 60deg horn:
An externally hosted image should be here but it was not working when we last tested it.
120deg horn:
An externally hosted image should be here but it was not working when we last tested it.
Well..
And here with longer time axis up to 10ms. See the room reflections hit after 4ms, carrying from every directions all that beautiful honk into your ears
60deg horn:
An externally hosted image should be here but it was not working when we last tested it.
120deg horn:
An externally hosted image should be here but it was not working when we last tested it.
One can also see from the room reflection pattern the difference in the directivity of the two horns.
- Elias
First measurements of conical dipole horns on NEO3W without any round over to possibly get the most horn honk ever.
The rectangular (almost quadratic) horns to measure – all with same contour length of ~20cm / 8":
...
60 deg included angle :
(Depth of horn ~ 17cm / 7")
...
120 deg included angle :
(Depth of horn ~ 10cm / 4")
Hello,
Without seeing the measurement environment, I would say everything before 3ms comes from the horn+cabinet and after 3ms is room reflections convoluted with the horn+cabinet response.
See here: At 3ms there is a presumable a reflection from a small object because there is no low frequencies present (low frequencies bypass the object by 'bending' over it). Maybe a microphone stand?
By the way, there seems to be some pre-ringing artefacts around 3kHz in both of 802 measurements. What that could be?
- Elias
Without seeing the measurement environment, I would say everything before 3ms comes from the horn+cabinet and after 3ms is room reflections convoluted with the horn+cabinet response.
See here: At 3ms there is a presumable a reflection from a small object because there is no low frequencies present (low frequencies bypass the object by 'bending' over it). Maybe a microphone stand?
An externally hosted image should be here but it was not working when we last tested it.
By the way, there seems to be some pre-ringing artefacts around 3kHz in both of 802 measurements. What that could be?
- Elias
In all the plots you did we can see a hot spot at about 5.5mS. I can easily see this in the impulse file. My guess is that it is a room reflection (side wall), tho it comes sooner than I would expect.
There is a smaller reflection at about 2mS on all my measurements too. It could be the mouth reflection, tho it does not really measure out for a round trip from mouth to driver and back. Close, but not exact.
Elias said:In CSD the 'ringing' continues as long as the last reflection dies out, because in CSD there is no temporal reolution finer than the FFT window width. What is seen in the CSD plot, it may not be a real resonance at all, but appears as such because of limited temporal resolution of the method.
I think CSD is a good method to mask the data from the observer Well, to be fair sometimes it can give some information, too
- Yes, the "usefullness" of CSD was hotly challenged here about a year ago by a subsequently banned member ( I think it occured within Lynn O(s) tome of a thread ) .
- The arguements against believing CSDs compromised resolution ( leading to no misleading conclusions / excepting pretty pictures ) were compelling enough .
- Perhaps we should stick to using GD / Impedance / Burst Decay Plots & of course Octave to show the way ?
<> cheers
Last edited:
I confirm, but if you listen to gated sinusoidal it rings there when the signal stops.Just FWIW and for fun. I was banging on my 511 horn today and looking at the resonance. It's right at 710Hz, very pure. Loooong decay. But you know what? I don't see it on the FR, distortion, CSD or burst charts? ??? Will do more looking.
Historically, I believe much more is made of damping the horn itself than apppears to be warranted in its measured performance, though it's clearly "excitable" at high SPL....

Last edited:
Panomaniac said:************
So.... from those plots, do we see Honk? I can't identify it (yet). The driver makes more difference than the horn. Too bad I don't have my paper tractrix horns any more. They might tell another story.
__________________
*
- Thirty years plus of SR work has left me with an indelible impression of what constitutes "Horn Honk" . For me, it's a frequency dependant, dynamic disconnection of signal, that no longer faithfully tracks the input signal. Like a solar flare, after it reaches critical resonance it just floats out there on its own , in all its' splendor . It generally takes some real input level to really get it going .
- So far all of the plots I've seen here show various forms of coloration / but no full bore honk . I suspect these tests are much too polite in level ( though I too don't want to crank out 110-120 db levels in my residence ) .

<< EarlK
ps : Hi Zilch !
Hello,
Do you have the impulse response of that data?
I'm almost most certain that everytime time passes a room reflection, the CSD drops a step
- Elias
Do you have the impulse response of that data?
I'm almost most certain that everytime time passes a room reflection, the CSD drops a step
- Elias
This is most interesting form me.
Maybe we should not only look at how quick decay happens, but even more so *how* decay looks like ?
When I investigated in closed pipes, internal Helmholtz resonators and other weird stuff, I came across some strange looking decay which I summarised at Lynn's thread once:
http://www.diyaudio.com/forums/multi-way/100392-beyond-ariel-14.html#post1202358
An externally hosted image should be here but it was not working when we last tested it.
An externally hosted image should be here but it was not working when we last tested it.
Above plots are at the bottom of the linked post.
IMO this is exactly the same behaviour as you (and Pano) measured – decay in *discrete steps*.
This isn't a "normal" decay, I'd say – but have looked at it (until now) only as a curiosity I once came across.
Might be – in the scope of this thread - we should pay some more attention to this and aim for an explanation ?
Hope wavelet analysis of Panos measurements puts some additional light on that...
Hello Earl,
If horn honk is level dependent, it cannot be seen in the impulse response. IR only describes a linear system i.e. no level dependence.
Maybe it's distortion that you heard, and relate it to the honk?
- Elias
If horn honk is level dependent, it cannot be seen in the impulse response. IR only describes a linear system i.e. no level dependence.
Maybe it's distortion that you heard, and relate it to the honk?
- Elias
- Thirty years plus of SR work has left me with an indelible impression of what constitutes "Horn Honk" . For me, it's a frequency dependant, dynamic disconnection of signal, that no longer faithfully tracks the input signal. Like a solar flare, after it reaches critical resonance it just floats out there on its own , in all its' splendor . It generally takes some real input level to really get it going .
- So far all of the plots I've seen here show various forms of coloration / but no full bore honk . I suspect these tests are much too polite in level ( though I too don't want to crank out 110-120 db levels in my residence ) .
<< EarlK
ps : Hi Zilch !
- Status
- This old topic is closed. If you want to reopen this topic, contact a moderator using the "Report Post" button.
- Home
- Loudspeakers
- Multi-Way
- Horn Honk $$ WANTED $$