It can't hurt to ask. Siegfried Linkwitz has already asked him to add the ability to normalize the sonograms to start at 0dB but no joy so far. That and adding his cosine-envelope sine waves to the signal generator.Thats good news ! - so an update for us from Ivo Mateljan is possibly only a few lines of code away...
")
It was on Lansing Heritage Forum. I did a search to link it here, but came up empty. The correct part for the waveguide is XT120. At that time, the driver/waveguide combo would have been XD120:Hello,
Where to find this information? I didn't find at diyaudio.
XT120 - Constant Coverage HF Horn
********
I have an Altec 511A horn here plus DE250 and BMS 4550 drivers plus a host of JBLs, but no Altecs. I need some assurance that the CLIO FR data and/or impulse graphic will get it done, tho. Otherwise, I'll have to kludge up a HOLMImpulse setup to generate .wav files....
********
Hi, Earl!
That may be the only time I've ever done a normalized CSD; it certainly lights up the resonances.
It's to the point now that I don't remember having done any of that.
[Good thing I post everything as it happens....
]
Last edited:
Jean-Michel,
I forgot to ask:
1) What was the measurement distance from the horn mouth to the microphone?
2) What is approximately the horn mouth diameter of this horn?
- Elias
I forgot to ask:
1) What was the measurement distance from the horn mouth to the microphone?
2) What is approximately the horn mouth diameter of this horn?
- Elias
You'll find in attached file (in text format) as .wav (48kHz, 16 bits) the impulse reponse I measured on one of my horns (Fc = 320Hz, T = 0.707). The driver is the TAD TD2001.
That seems interesting, because my Energy Time Curves and impulse data shown from AxiDriver simulations also show similar things after 3ms. Sims with direct radiating drivers don't have this. What do you see up to 17ms?A zoomed version of the previous picture. Now 1kHz-20kHz and up to 6ms.
Jean-Michel: What happens after 3ms? Floor reflection?
- Elias
I'd be happy to post (or send) measurements of the Altec 511 and 811 with 806 and 802 drivers.
I can measure and export from HolmImpulse, but please tell me what is needed.
Just let me know and I'll do it.
I can measure and export from HolmImpulse, but please tell me what is needed.
- 1M on axis? Gated?
- High pass set where?
- Or no high pass and limited sweep?
- How to export the information.
- 16 bit 48Khz wav file or text file?
Just let me know and I'll do it.
Hello Elias,
That measurement is made in my small living room. (aftre 3ms there is probably reflections)
Distance of the microphone from mouth is 1meter.
The mouth of that horn (Fc = 320Hz, T = 0.707) possess a 65centimeters diameter.
You should compare with the theorical pulse response as calculated by Hornresp (here attached)
Best regards from Paris, France
Jean-Michel Le Cléac'h
A zoomed version of the previous picture. Now 1kHz-20kHz and up to 6ms.
Jean-Michel: What happens after 3ms? Floor reflection?
- Elias
Attachments
Hello Elias,
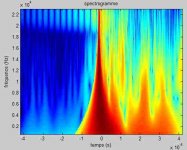
Here is, for the same IR pulse of the 320Hz Le Cléac'h horn, the output of my own piece of spectrogram I wrote many years ago (under Matlab).
Strangely I find this presentation less useful than CSD... so I never completed it (the vertical scale is not correctly labelled) and I never used it.
Best regards from Paris, France
Jean-Michel Le Cléac'h
A zoomed version of the previous picture. Now 1kHz-20kHz and up to 6ms.
Jean-Michel: What happens after 3ms? Floor reflection?
- Elias
Attachments
Last edited:
I have made some experimenting, last year, with my device for measure horn's reflection/diffraction to highlight its role on the GD.
Instead of use the driver like a microphone, I have use a real measurement mic.
The idea is, if a put a tube between driver and horn, I have less GD than without tube if the windowing is the firsts 6ms (No echo with 1 meter tube).
It was the case but not really enough conclusive for me, but it's possible that I have measure only the GD of driver without its GD's horn.
Last edited:
Hello Jean-Michel,
I agree, the way you plot the data is not useful. Mostly what is visible in your plot are non-idealities of your impulse response measurement system! They don't belong to the behaviour of the horn itself, and are only masking the real horn behaviour to be seen by the human eye.
What is the dynamic range of the plot? 80dB?
One needs to adjust the plot to see the phenomena one is looking for. The data is there, in the impulse response, only it's needed to adjust the 'magnifier' to make it visible.
- Elias
Here is, for the same IR pulse of the 320Hz Le Cléac'h horn, the output of my own piece of spectrogram I wrote many years ago (under Matlab).
Strangely I find this presentation less useful than CSD... so I never completed it (the vertical scale is not correctly labelled) and I never used it.
Hello,
Great!
Maybe something like this would be ok:
* 1m on axis
* NO time gating, what we want is full impulse response
* How low those drivers can go? HP you can choose appropriately.
* 48kHz 16bit is fine
* impulse response saved as either WAV or ASCII file
- Elias
Great!
Maybe something like this would be ok:
* 1m on axis
* NO time gating, what we want is full impulse response
* How low those drivers can go? HP you can choose appropriately.
* 48kHz 16bit is fine
* impulse response saved as either WAV or ASCII file
- Elias
I'd be happy to post (or send) measurements of the Altec 511 and 811 with 806 and 802 drivers.
I can measure and export from HolmImpulse, but please tell me what is needed.
- 1M on axis? Gated?
- High pass set where?
- Or no high pass and limited sweep?
- How to export the information.
- 16 bit 48Khz wav file or text file?
Just let me know and I'll do it.
Nevermind about the silly question above....
I get this far...I can plot my wav file (2D plot)
Catapult, for some reason I can not read your wave file, Octave says "error: 'wavread' file contains no RIFF chunk.
Now I can plot the impulse but I need to find the commands to do the wavelet graphics.
I get this far...I can plot my wav file (2D plot)
An externally hosted image should be here but it was not working when we last tested it.
Catapult, for some reason I can not read your wave file, Octave says "error: 'wavread' file contains no RIFF chunk.
Now I can plot the impulse but I need to find the commands to do the wavelet graphics.
Last edited:
Hi Earl, hi Zilch
impressive plots - but how you think these loooooong decays - in steps even - come from?
Also those resonances are veeery close to each other ??
Does not look like a usual horn or quarter wave behaviour to me - any conclusions or theories ? - maybe material resonance (the metal bars ?) of the horn contour?
How was measurement setup ?
Michael
Last edited:
First measurements of conical dipole horns on NEO3W without any round over to possibly get the most horn honk ever.
The rectangular (almost quadratic) horns to measure – all with same contour length of ~20cm / 8":
(180deg = OB is missing here)

60 deg included angle :
(Depth of horn ~ 17cm / 7")
http://www.kinotechnik.edis.at/pages/diyaudio/GD_HighPass/conical/60-deg_incl.pir
http://www.kinotechnik.edis.at/pages/diyaudio/GD_HighPass/conical/60-deg_incl.wav


120 deg included angle :
(Depth of horn ~ 10cm / 4")
http://www.kinotechnik.edis.at/pages/diyaudio/GD_HighPass/conical/120-deg_incl.pir
http://www.kinotechnik.edis.at/pages/diyaudio/GD_HighPass/conical/120-deg_incl.wav


Above "burst decay" visualisation in ARTA is a wavelet analysis too, but I really would wish for the scaling of the axis as "time" rather than in "periods".
Also a "normalisation" function would be extremely helpful to get the picture clean IMO – meaning not to get trapped by peaks in the frequency response that possibly stick out later on too...
Below is a "conversion grid" that may help to convert the above plots into time referenced ones.
I know, not very comfortable – but that's best *I* can do for now – hope Elias will help us out once more ...

The 4ms trace is more or less the limit due to bottom reflections at indoor measurements...
Measurements for the 0 deg included (transmission line) and for 180 deg included (open baffel) will follow (hopefully )
###########
Thanks a lot for your "How To" on getting the best out of ARTA, Jean-Michel.
For GD I think I got it now – but for CSD there is something that seems to be missing to get the clean plots you showed (especially the clean "attack").
Michael
The rectangular (almost quadratic) horns to measure – all with same contour length of ~20cm / 8":
(180deg = OB is missing here)
60 deg included angle :
(Depth of horn ~ 17cm / 7")
http://www.kinotechnik.edis.at/pages/diyaudio/GD_HighPass/conical/60-deg_incl.pir
http://www.kinotechnik.edis.at/pages/diyaudio/GD_HighPass/conical/60-deg_incl.wav
120 deg included angle :
(Depth of horn ~ 10cm / 4")
http://www.kinotechnik.edis.at/pages/diyaudio/GD_HighPass/conical/120-deg_incl.pir
http://www.kinotechnik.edis.at/pages/diyaudio/GD_HighPass/conical/120-deg_incl.wav
Above "burst decay" visualisation in ARTA is a wavelet analysis too, but I really would wish for the scaling of the axis as "time" rather than in "periods".
Also a "normalisation" function would be extremely helpful to get the picture clean IMO – meaning not to get trapped by peaks in the frequency response that possibly stick out later on too...
Below is a "conversion grid" that may help to convert the above plots into time referenced ones.
I know, not very comfortable – but that's best *I* can do for now – hope Elias will help us out once more ...
The 4ms trace is more or less the limit due to bottom reflections at indoor measurements...
Measurements for the 0 deg included (transmission line) and for 180 deg included (open baffel) will follow (hopefully
)###########
Thanks a lot for your "How To" on getting the best out of ARTA, Jean-Michel.
For GD I think I got it now – but for CSD there is something that seems to be missing to get the clean plots you showed (especially the clean "attack").
Michael
Last edited:
Rudimentary, at best.How was measurement setup?
I was trying to see which rang worse, 811 or 511.
811 sounds harsh to me, whereas 511, despite ringing like a bell, has a rather pleasant "woody" coloration to it, in my view.
Don't know if that's meaningful to anyone, but 511 IS well-suited to hanging on the porch of the ranch house....
Hi,
- Because I live in an apartment & measure this stuff in place , I typically measure at a distance of less than 1/2 a meter .
- It might be ambient noise, hard to know . I consistantly get something ( resonances ) appearing at minus 20 db & lower ( so does Zilch in most of his CSDs , btw ) .


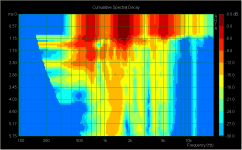
- I pointed out his 811b CSD ( seen above ) because that normalized plot shows a lot of energy just 10 db below the fundamental response .


- When Zilch changed drivers on the 811b ( from Altec to Selenium ) the "ringing" drops to 20 db below ( see above ) .
- The swap suggests the driver ( Altec 902-8B ) is responsible for the excessive ringing ___except___ that ( to my satisfaction ) I showed that other Altec drivers on different horns are at the expected 20 db down point ( for resonances ) . See below :


- The apparent paradox ( the source for the extra 10 db of ringing ) has never been resolved ( which is why I'd like to see some data from Pano ) .

- Here's the horn that I measured the Altec and B&C drivers on ( seen above / this one belongs to Zilch ) .
- Because ARTA doesn't have a normalize ( first ) function for the CSDs , I typically build up a passive filter to flatten the response as best as I can .
- So, as much as, 5 Ms long / 20 db down, is loooong ?
<> cheers
Michael said:How was measurement setup ?
- Because I live in an apartment & measure this stuff in place , I typically measure at a distance of less than 1/2 a meter .
Michael said:Does not look like a usual horn or quarter wave behaviour to me - any conclusions or theories ? - maybe material resonance (the metal bars ?) of the horn contour?
- It might be ambient noise, hard to know . I consistantly get something ( resonances ) appearing at minus 20 db & lower ( so does Zilch in most of his CSDs , btw ) .
- I pointed out his 811b CSD ( seen above ) because that normalized plot shows a lot of energy just 10 db below the fundamental response .
- When Zilch changed drivers on the 811b ( from Altec to Selenium ) the "ringing" drops to 20 db below ( see above ) .
- The swap suggests the driver ( Altec 902-8B ) is responsible for the excessive ringing ___except___ that ( to my satisfaction ) I showed that other Altec drivers on different horns are at the expected 20 db down point ( for resonances ) . See below :
- The apparent paradox ( the source for the extra 10 db of ringing ) has never been resolved ( which is why I'd like to see some data from Pano ) .
- Here's the horn that I measured the Altec and B&C drivers on ( seen above / this one belongs to Zilch ) .
- Because ARTA doesn't have a normalize ( first ) function for the CSDs , I typically build up a passive filter to flatten the response as best as I can .
Michael said:impressive plots - but how you think these loooooong decays - in steps even - come from?
Also those resonances are veeery close to each other ??
- So, as much as, 5 Ms long / 20 db down, is loooong ?
<> cheers
OK, here is the data zipped up.
What's in the zip file is 4 impulse measurements in wav format, + a text document explaining test conditions.
I tested both the Altec 811 & 511 horns. Each horn was tested with the 806A and 802-8D driver. 1 meter, on axis. Average SPL 85dB. Sweep from 250Hz up, no high pass filter. EL34 P-P amp with L-Pad before horns.
Horns were set on top of Altec 828 bass cabinet (A7) as they would be in actual use.
To my ear, the 806 driver sounds much better on either horn. The measurements bear this out. The 806 has much lower distortion and a flatter response than the 802 with its "Symbiotic" fram. (I hope to test the light aluminum frams in the 802 soon).
If the same sonograms are run on these impulses, we should be able to see where the honk may be on each horn. Hopefully using 2 different drivers will allow us to see the horn better.
I can post burst decay graphs from Arta, if anyone is interested.
Attachments
811 sounds harsh to me, whereas 511, despite ringing like a bell, has a rather pleasant "woody" coloration to it, in my view.
Don't know if that's meaningful to anyone, but 511 IS well-suited to hanging on the porch of the ranch house....
- not sure how and to what extend it will help us to cut down to the bones of honk – but at least I now have sort of impression what this famous horns may sound like – thanks Zilch !
- It might be ambient noise, hard to know . I consistantly get something ( resonances ) appearing at minus 20 db & lower ( so does Zilch in most of his CSDs , btw ) .
- When Zilch changed drivers on the 811b ( from Altec to Selenium ) the "ringing" drops to 20 db below ( see above ) .
- The apparent paradox ( the source for the extra 10 db of ringing ) has never been resolved ( which is why I'd like to see some data from Pano ) .
- So, as much as, 5 Ms long / 20 db down, is loooong ?
This is most interesting form me.
Maybe we should not only look at how quick decay happens, but even more so *how* decay looks like ?
When I investigated in closed pipes, internal Helmholtz resonators and other weird stuff, I came across some strange looking decay which I summarised at Lynn's thread once:
http://www.diyaudio.com/forums/multi-way/100392-beyond-ariel-14.html#post1202358
An externally hosted image should be here but it was not working when we last tested it.
An externally hosted image should be here but it was not working when we last tested it.
Above plots are at the bottom of the linked post.
IMO this is exactly the same behaviour as you (and Pano) measured – decay in *discrete steps*.
This isn't a "normal" decay, I'd say – but have looked at it (until now) only as a curiosity I once came across.
Might be – in the scope of this thread - we should pay some more attention to this and aim for an explanation ?
Hope wavelet analysis of Panos measurements puts some additional light on that...
- Because ARTA doesn't have a normalize ( first ) function for the CSDs , I typically build up a passive filter to flatten the response as best as I can .
Yes, such a "normalize first" feature I would love to see implemented as well !
Michael
Last edited:
- Status
- This old topic is closed. If you want to reopen this topic, contact a moderator using the "Report Post" button.
- Home
- Loudspeakers
- Multi-Way
- Horn Honk $$ WANTED $$